
.
Nuclear Clocks
The Understanding the Atom Series
Nuclear Energy is playing a vital role in the life of every man, woman, and child in the United States today. In the years ahead it will affect increasingly all the peoples of the earth. It is essential that all Americans gain an understanding of this vital force if they are to discharge thoughtfully their responsibilities as citizens and if they are to realize fully the myriad benefits that nuclear energy offers them.
The United States Atomic Energy Commission provides this booklet to help you achieve such understanding.

Edward J. Brunenkant, Director Division of Technical Information
UNITED STATES ATOMIC ENERGY COMMISSION
Dr. Glenn T. Seaborg, Chairman
James T. Ramey
Wilfrid E. Johnson
Francesco Costagliola
by Henry Faul
CONTENTS
- INTRODUCTION 1
- THEORY OF NUCLEAR AGE DETERMINATION 5
- THE CARBON-14 CLOCK 9
- Carbon-14 Counting 12
- Carbon-14 Results 15
- THE LONG-LIVED CLOCKS 19
- The Rubidium-Strontium Clock 20
- The Uranium Fission Clock 24
- Plumbology 27
- THE AGE OF THE EARTH 27
- Analytical Techniques 31
- Minerals That Can Be Dated 34
- SOME INTERESTING RESULTS 40
- The Old Man From Olduvai 40
- The Geologic Time Scale 41
- Precambrian Stratigraphy 47
- AND WHERE DO WE GO FROM HERE? 48
- GLOSSARY 49
- APPENDIX 52
- SUGGESTED REFERENCES 58
United States Atomic Energy Commission
Division of Technical Information
Library of Congress Catalog Card Number: 67-60195
1966; 1968(Rev.)
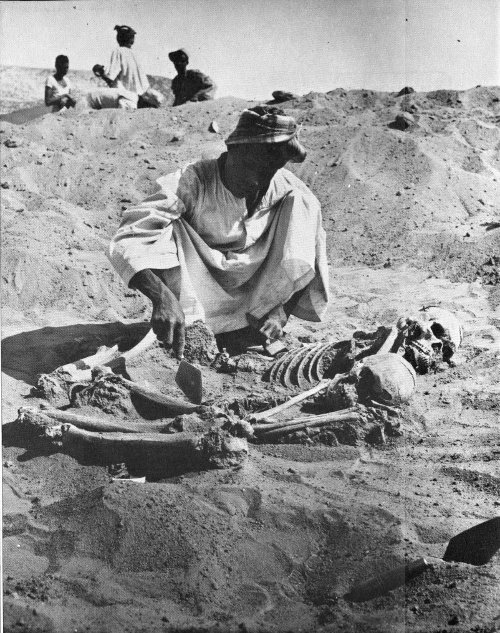
A 14,000-year-old burial site being uncovered in the area of the Aswan Reservoir in Sudan. To determine the age of such ancient remains, archaeologists search for every scrap of associated wood or charcoal that could be used for age measurement of carbon-14, one of the “nuclear clocks” described in this booklet.
By HENRY FAUL
INTRODUCTION
How old is a rock?
How old is man?
How old is the earth?
It would be difficult to find a reason why anyone would really have to know the answers to these questions, yet they have been asked over and over again since the dawn of human society. The records of every civilization disclose attempts to delve into the past beyond the memory of the oldest man, beyond recorded history, beyond earliest legend.
Curiosity about the remote past may be very ancient, but the only reliable method of measuring very long intervals of time is new. The possibility of doing so became apparent only after the discovery of RADIOACTIVITY[1] in 1896 by Henri Becquerel, when Marie and Pierre Curie in 1898 recognized that some atoms are radioactive and change by themselves into other atoms at regular and constant rates. 2 If something gradually transforms itself into something else, if this transformation goes on at a known pace, and if all the products of the activity are preserved in some kind of a CLOSED SYSTEM, then it is theoretically possible to calculate the time that has elapsed since the process started. The theory was clear for years; the only problem was how to satisfy all those ifs.
By 1910 it was well established that the earth must be extremely ancient. Analyses of some minerals containing uranium showed them to be hundreds of millions of years old, even though the uranium came from rocks that were known to be relatively young among geologic STRATA. Measurements still were inaccurate, however, and only a few rare and unusually rich radioactive minerals contained enough of the products of RADIOACTIVE DECAY[2] to allow analysis of their age by the crude methods then available.
Not much progress was made for about 30 years until A. O. C. Nier, a Harvard University physicist, perfected an instrument called a MASS SPECTROMETER (to be described later) just before World War II. The rapid technological advances of the war years followed. The Manhattan Project[3] made the atomic bombs that ended the fighting; it also developed new scientific techniques that could be applied, when peace returned, to the measurement of geologic time.
The next important advance was contributed in 1946 by Arthur Holmes in England and by F. G. Houtermans in Germany. Each of these scientists had seen Nier’s reports before the war and had realized that Nier’s mass-spectrometer analyses of lead made it possible, for the first time, to make rational calculations about the age of the earth. The two scientists independently calculated that age at about 2 to 3 billion years, using the handful of data available to them from Nier’s measurements. It is interesting that today, thousands of analyses later, our planet’s age usually is given as 4.5 billion years. The early estimates were not far off.
Development of various methods for measuring the age of minerals followed rapidly, and by 1955 many fundamental studies needed for measuring the age of very old substances were complete. The basic techniques are summarized in Table I. They will be explained later. The new methods produced broad confirmation of the early rough estimates and they also brought a few surprises.
Before we go into these discoveries, let us look at some theoretical foundations.
| Table I BASIC MEASUREMENT METHODS | |||
|---|---|---|---|
| Method | Material | Time Dated | Useful Time Span (years) |
| Carbon-14 | Wood, peat, charcoal | When plant died | 1000-50,000 |
| Bone, shell | Slightly before animal died | 2000-35,000 | |
| Potassium-argon | Mica, some whole rocks | When rock last cooled to about 300°C | 100,000 and up |
| Hornblende Sanidine | When rock last cooled to about 500°C | 10,000,000 and up | |
| Rubidium-strontium | Mica | When rock last cooled to about 300°C | 5,000,000 and up |
| Potash feldspar | When rock last cooled to about 500°C | 50,000,000 and up | |
| Whole rock | Time of separation of the rock as a closed unit | 100,000,000 and up | |
| Uranium-lead | Zircon | When crystals formed | 200,000,000 and up |
| Uranium-238 fission | Many | When rock last cooled | 100-1,000,000,000 (Depending on material) |
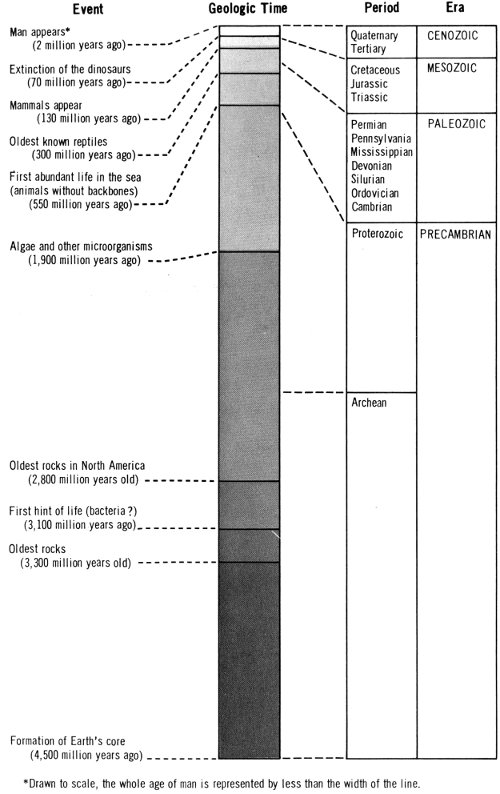
Time scale of the Earth, drawn to scale. See also the Holmes time scale on page 46.
| Event Geologic Time | Period | Era | |
|---|---|---|---|
| Man appears[4] (2 million years ago) | |||
| Quaternary | CENOZOIC | ||
| Tertiary | |||
| Extinction of the dinosaurs (70 million years ago) | |||
| Cretaceous | MESOZOIC | ||
| Mammals appear (130 million years ago) | Jurassic | ||
| Triassic | |||
| Oldest known reptiles (300 million years ago) | Permian | PALEOZOIC | |
| Pennsylvanian | |||
| Mississippian | |||
| Devonian | |||
| Silurian | |||
| Ordovician | |||
| Cambrian | |||
| First abundant life in the sea (animals without backbones) (550 million years ago) | |||
| Algae and other microorganisms (1,900 million years ago) | Proterozoic | PRECAMBRIAN | |
| Archean | |||
| Oldest rocks in North America (2,800 million years ago) | |||
| First hint of life (bacteria?) (3,100 million years ago) | |||
| Oldest rocks (3,300 million years old) | |||
| Formation of Earth’s core (4,500 million years ago) |
THEORY OF NUCLEAR AGE DETERMINATION
We can think of the nucleus of an atom as a sort of drop—a bunch of NEUTRONS and PROTONS held together by very strong short-range forces. These elementary particles within a nucleus are not arranged in any fixed or rigid array, but are free to move about within the grip of these forces. These motions may be quite violent, but for most NUCLIDES found in nature, the nuclear forces are powerful enough to keep everything confined; thus the nuclei of these atoms hold together, and are said to be stable. If any one nucleus of a given ISOTOPE is stable, then all others are also stable, because what is true for one atom of a given kind is true for all others of the same kind.[5]
Some nuclides, both man-made and natural, are unstable, however. Their nuclei are in such violent turmoil that the nuclear forces cannot always hold them together, and various bits and pieces fly off. If we were to try to predict when one particular unstable nucleus would thus disintegrate, however, we could not succeed, because the instant any specific decay (or disintegration) event will occur is a matter of chance. Only if a large number of unstable nuclei of one kind are collected together can we say with certainty that, out of that number, a certain proportion will decay in a given time. It turns out that this proportion is the same regardless of any external conditions.
This property of nuclei to decay by themselves is called radioactivity. Radioactive nuclei decay at constant rates regardless of temperature, pressure, chemical combination, or physical state. The process goes on no matter what happens to the atom. In other words, the activity inside the nucleus is in no way affected by what happens to the ELECTRONS circling around it. (Only in very special cases can outside disturbances affect the radioactivity of a nucleus and then only slightly. For all practical purposes, rates of radioactive decay are constant.)
Most radioactive nuclides have rapid rates of decay (and lose their radioactivity in a few days, or a few years, at most); most of these are known today only because they are produced artificially. Some of them may have been present at the time the solar system was formed, but they have since decayed to such insignificant fractions of their original amounts that they can no longer be detected. Only a few radioactive nuclides decay slowly enough to have been preserved to this day, and so are present in nature. They are listed in Table II.
| Table II RADIOACTIVE NUCLIDES WITH HALF-LIVES LARGE ENOUGH TO BE STILL PRESENT IN USEFUL AMOUNTS ON THE EARTH[6] | |||
|---|---|---|---|
| PARENT Element | DAUGHTER Product | HALF-LIFE (years) | Type of Decay |
| Potassium-40 | Argon-40 | 1.3 × 10⁹ (total) | ELECTRON CAPTURE |
| Calcium-40 | BETA DECAY | ||
| Vanadium-50 | Titanium-50 | ~6 × 10¹⁵ (total) | Electron capture |
| Chromium-50 | Beta decay | ||
| Rubidium-87 | Strontium-87 | 4.7 × 10¹⁰ | Beta decay |
| Indium-115 | Tin-115 | 5 × 10¹⁴ | Beta decay |
| Tellurium-123 | Antimony-123 | 1.2 × 10¹³ | Electron capture |
| Lanthanum-138 | Barium-138 | 1.1 × 10¹¹ (total) | Electron capture |
| Cerium-138 | Beta decay | ||
| Cerium-142 | Barium-138 | 5 × 10¹⁵ | ALPHA DECAY |
| Neodymium-144 | Cerium-140 | 2.4 × 10¹⁵ | Alpha decay |
| Samarium-147 | Neodymium-143 | 1.06 × 10¹¹ | Alpha decay |
| Samarium-148 | Neodymium-144 | 1.2 × 10¹³ | Alpha decay |
| Samarium-149 | Neodymium-145 | ~4 × 10¹⁴? | Alpha decay |
| Gadolinium-152 | Samarium-148 | 1.1 × 10¹⁴ | Alpha decay |
| Dysprosium-156 | Gadolinium-152 | 2 × 10¹⁴ | Alpha decay |
| Hafnium-174 | Ytterbium-170 | 4.3 × 10¹⁵ | Alpha decay |
| Lutetium-176 | Hafnium-176 | 2.2 × 10¹⁰ | Beta decay |
| Rhenium-187 | Osmium-187 | 4 × 10¹⁰ | Beta decay |
| Platinum-190 | Osmium-186 | 7 × 10¹¹ | Alpha decay |
| Lead-204 | Mercury-200 | 1.4 × 10¹⁷ | Alpha decay |
| Thorium-232 | Lead-208 | 1.41 × 10¹⁰ | 6 Alpha + 4 beta[7] |
| Uranium-235 | Lead-207 | 7.13 × 10⁸ | 7 Alpha + 4 beta |
| Uranium-238 | Lead-206 | 4.51 × 10⁸ | 8 Alpha + 6 beta |
In a large number of radioactive nuclei of a given kind, a certain fraction will decay in a specific length of time. Let’s take this fraction as one-half and measure the time it takes for half the nuclei to decay. This time it is called the HALF-LIFE of that particular nucleus and there are various accurate physical ways of measuring it. During the interval of one half-life, one-half of the nuclei will decay, during the next half-life half of what’s left will decay, and so on. We may tabulate it like this:
| Elapsed time (Number of half-lives) | Amount left of what was originally present |
|---|---|
| 1 | ½ |
| 2 | ¼ |
| 3 | ⅛ |
| 4 | ¹/₁₆ |
| 5 | ¹/₃₂ |
| 6 | ¹/₆₄ |
| 7 | ¹/₁₂₈ |
| ... | ... |
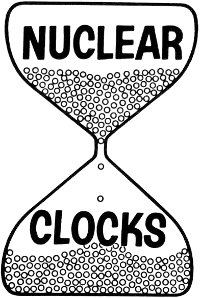
In other words, after seven half-lives, less than 1% of the original amount of material will still be radioactive and the remaining 99%+ of its atoms will have been converted to atoms of another nuclide. This kind of process can be made the basis of a clock. It works, in effect, like the upper chamber of an hourglass. Mathematically it is written:
N = N₀e-λt
- where
- N = the number of radioactive atoms present in the system now,
- N₀ = the number that was present when t = 0, (in other words, at the time the clock started),
- e = the base of natural (or Napierian[8]) logarithms (the numerical value of e = 2.718 ...),
- λ (lambda) = the decay rate of the radioactive material, expressed in atoms decaying per atom per unit of time,
- t = the time that has elapsed since the origin of system, expressed in the same units.
Obviously, in ordinary computations that would not be enough information to calculate the time, because there still are two unknowns, N₀ and t. In a closed system, however, the atoms that have decayed do not disappear into thin air. They merely change into other atoms, called daughter atoms, and remain in the system.
And at any point in time, there will be both PARENT and DAUGHTER atoms mixed together in the material. The older the material, the more daughters and the fewer parents. Some daughters are also radioactive, but this does not change the basic situation. Thus it follows that
N₀ = N + D
where D = the number of daughter (decayed) atoms. We may then substitute into the first equation
N = (N + D) e-λt
and solve
t = 1/λ · ln(1 + D/N)
where ln = the natural logarithm, the logarithm to base e.
This kind of system can be represented crudely by an old-fashioned hourglass, as shown in the figure, which has the parameters of these equations marked. (Keep in mind, however, that this is only a gross analogy. Nuclear clocks run at logarithmically decreasing rates, but the speed of a good hourglass is roughly constant.)
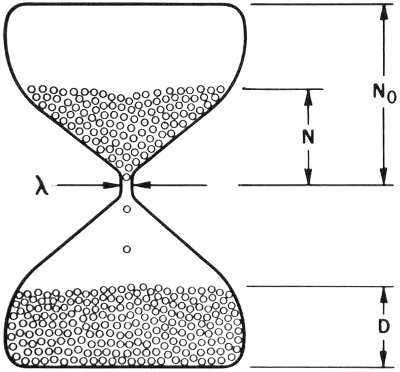
An hourglass illustrates an ideal closed system. Nothing is added and nothing is removed—the sand just runs from the top bulb to the bottom.
Remember that the decaying nucleus does not disappear. It changes into another nucleus, and this new nucleus forms an atom that may be captured and held fixed by natural processes. The decayed nuclei are thus collected, so that here we have the bottom chamber of the hourglass.
But sometimes we need only the top chamber of an hourglass.
THE CARBON-14 CLOCK
Carbon-14 decay is the best example of a top-only hourglass. Carbon-14 is constantly being produced in the upper atmosphere from atoms of nitrogen-14 being struck by neutrons that had their origin in COSMIC RAYS. The reaction is written:
¹⁴N + neutron → ¹⁴C + proton
Radioactive decay then follows, with a half-life of 5800 years[9] for the ¹⁴C.
¹⁴C → ¹⁴N + electron (BETA PARTICLE)
The radiocarbon emits an electron and changes back into nitrogen.
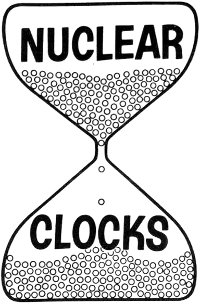
As far as anyone can tell, ¹⁴C was produced at a constant rate above the earth for at least 50,000 years before the first atomic bomb was exploded. In other words, the ¹⁴C cycle is like an hourglass in which the sand in the upper part is replenished as fast as it runs out through the hole in the waist. A process of this sort, where production equals decay, is called a SECULAR EQUILIBRIUM.
The newly produced ¹⁴C soon is evenly mixed with the carbon dioxide in the air, is taken up by all living plants, 10 and then finds its way into all living animals. In effect, all carbon in living organisms contains a constant proportion of ¹⁴C. If any of this carbon is taken out of circulation—when a tree branch is broken off, for instance, or when a shellfish dies in the ocean—no more new ¹⁴C is added to that particular system, but the old ¹⁴C continues to run out. In effect it now starts measuring time as an hourglass should.
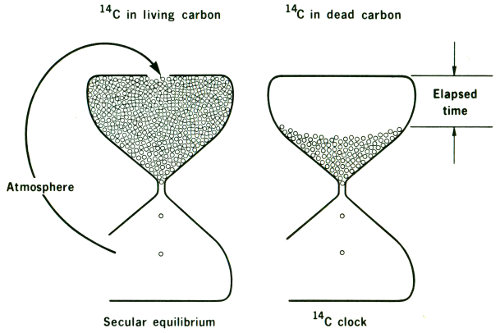
To illustrate secular equilibrium, one must imagine an hourglass in which the sand in the top bulb is continuously replenished—as fast as it runs out through the hole in the waist and disappears.
When we find a piece of charcoal in a cave or a piece of wood in some ancient structure, for example, we can measure the amount of carbon in it, determine how much of it is ¹⁴C, and then calculate back to the time when the radioactivity from the ¹⁴C was the same as we now find in living wood. In other words, if we assume that we know from the observed secular equilibrium how much ¹⁴C originally was present in living material, then we can calculate the time of death of any similar but ancient material. That is the basis of the ¹⁴C method of age determination.
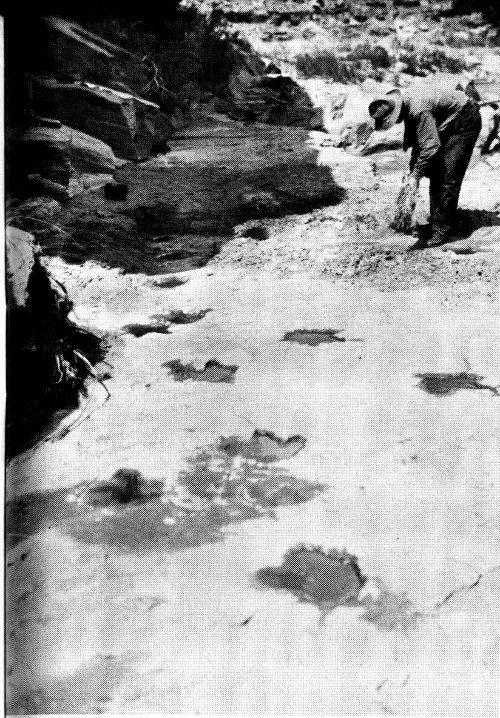
Dinosaur tracks imprinted in rock in Navajo Canyon, Arizona, arouse the professional interest of this scientist. Fossil traces of extinct prehistoric creatures were for a long time the best clues to the age of rock formations.
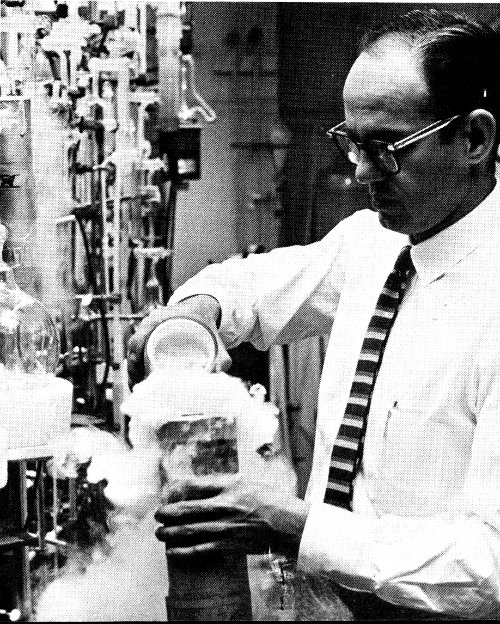
A scientist using liquid nitrogen to freeze carbon dioxide gas made from a sample of ancient material that he is preparing for age determination by the carbon-14 technique.
For example, a bit of a rafter from a prehistoric cliff-dwelling or a remnant of charcoal from an ancient fire may be analyzed for its remaining ¹⁴C content, and its age determined accurately within the margin of a few hundred years. This fixes the time at which the wood for the rafter or the firewood was broken or cut from the living tree, and hence the period in which the men lived who used the wood.
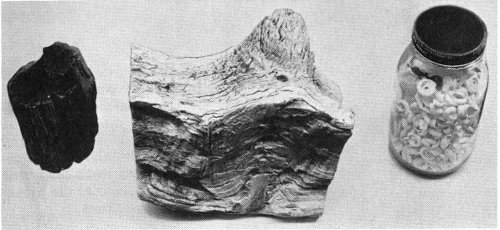
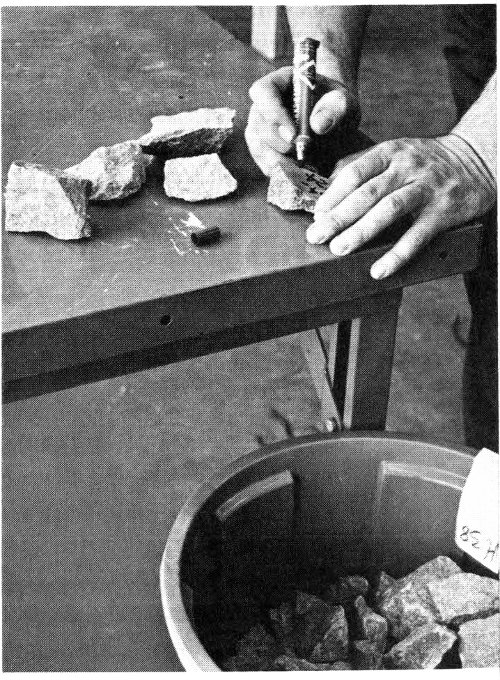
The most useful samples for carbon-14 age determination are charcoal, wood, and shells.
Carbon-14 Counting
Carbon-14 measurements are made by taking a known amount of carbon, reducing it to a gas, and then counting the ¹⁴C disintegrations in the gas. This may sound simple, but in reality the measurement process is a formidable undertaking, because the amount of the ¹⁴C isotope in the carbon is so extremely small. (The remainder of the carbon, of course, consists of other isotopes—¹²C or ¹³C, which are stable.)
There are two basic techniques. The carbon can be:
1. Burned with oxygen to form carbon dioxide, or
2. Reduced chemically to methane or ethane, or to a carbide from which acetylene can be evolved by adding water. (See booklet cover and description on page 59.)
The first technique is the simpler, but carbon dioxide (CO₂) contains only one atom of carbon per molecule, whereas acetylene (C₂H₂) and ethane (C₂H₆) each contain two. Consequently, the SPECIFIC ACTIVITY of acetylene or 13 ethane is twice that of carbon dioxide, other things being equal. For that reason acetylene or ethane are the preferred gases in some laboratories. On the other hand, they are explosive, and that cautions other scientists into using the carbon dioxide method.
Whichever gas is used, it is first purified and then stored in a bottle for a month or so. This storage allows for decay (disappearance) of any radon, the gaseous radioactive product of uranium decay. Uranium contamination is difficult to avoid at the low radioactivity levels of ¹⁴C, but the half-life of radon is only 3.82 days, so that it will decay to an insignificant level in a month. After the storage period, the gas is pumped into an array of instruments known as a low-background PROPORTIONAL COUNTER, and its radioactivity is determined. This is an involved process. First there is the matter of the BACKGROUND COUNT.
The background count of an instrument is the number of pulses (counts) it will give per unit time when there is no radioactive sample in it. These counts are caused by cosmic rays, by radioactive contamination always found in the vicinity of the counter, or by any contamination inside the instrument. In ¹⁴C counting, all these sources of background must be reduced to negligible levels. This is done in a number of ways.
For one thing, the whole assembly is constructed with surrounding walls of lead or iron more than a foot thick. Such a shield will stop all the GAMMA RAYS coming from radioactive contamination in the laboratory and much of the cosmic radiation; high-energy cosmic rays and all neutrons still will get through. Therefore, there is an ANTICOINCIDENCE RING inside the lead shield. This is a cylindrical space completely surrounded by GEIGER COUNTERS that are connected to each other and to the SAMPLE COUNTER in the middle. With this arrangement, when the sample counter and any ring counter discharge simultaneously, it is a signal that the pulse triggering this response was caused by some energetic particles, such as a cosmic ray, passing through the whole assembly. A pulse recorded simultaneously on two counters is automatically rejected from the counting mechanisms. Some instruments have been designed with a cylinder of paraffin immediately 14 inside the anticoincidence ring, to slow down neutrons so that they can be captured, and with a final shield of highly purified mercury between two cylinders of selected steel to hold out even more unwanted radiation.
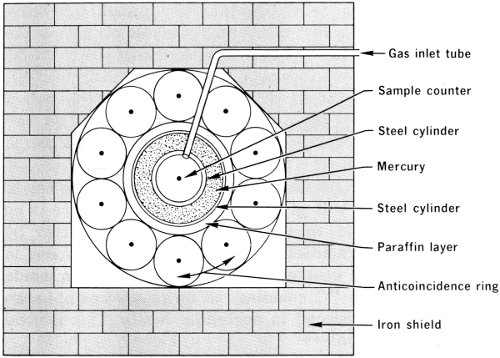
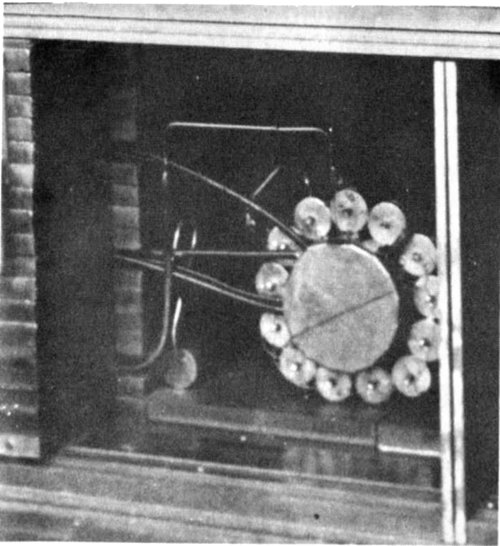
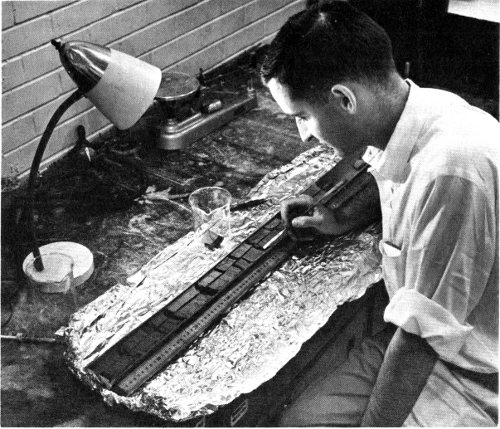
A carbon-14 counter. Sketch (above) shows arrangement of components in photo (left).
Finally, the sample counters are made of specially selected metal tubing that is extremely low in radioactive 15 content, with a fine wire stretched down the middle. (In some recent designs, the anticoincidence ring and sample counter are combined in a single cylindrical housing with a thin foil of metallized plastic between them.) A thin glass filling tube connects the sample counter with the outside world.
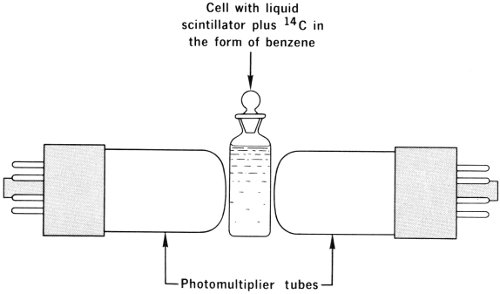
Detail of one type of sample-counting tube for carbon-14 work. Carbon-14 in benzene gas molecules is placed in the central cell and mixed with a fluid that scintillates, or emits light flashes, when exposed to radiation. Photomultiplier tubes convert the flashes to electric signals.
The radiocarbon-bearing gas is pumped into the sample counter through the filling tube, and all the counts resulting from its disintegrations are recorded electronically. The age of the sample is calculated from the NET COUNTING RATE (the sample counting rate minus the background); the lower the counting rate the higher the age. The upper limit of the age that can be measured is determined by the STATISTICAL ERROR (that is, by the measure of the instrument accuracy) in the net count. In very old samples this error may be great enough so that the calculated age of the sample may have little or no meaning.
Carbon-14 Results
OBJECTS DATED BY RADIOCARBON

Hair of an Egyptian woman. 5020 ± 290 years old.
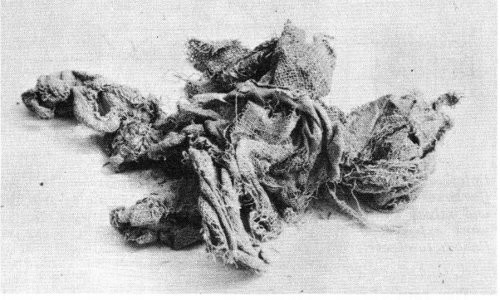
Linen wrapping from the Dead Sea Scroll containing the Book of Isaiah. 1917 ± 200 years old.
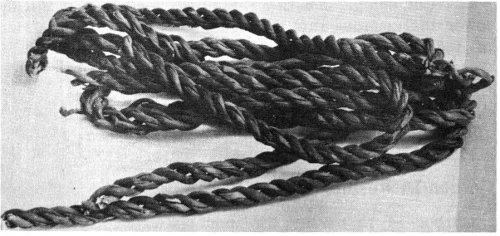
Peruvian rope. 2632 ± 200 years old.
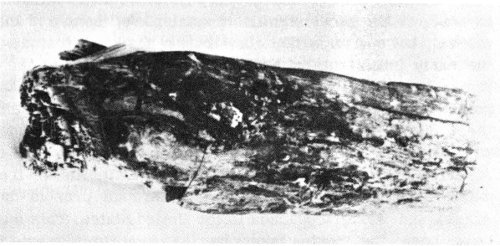
Preglacial wood found in Ohio. More than 20,000 years old.
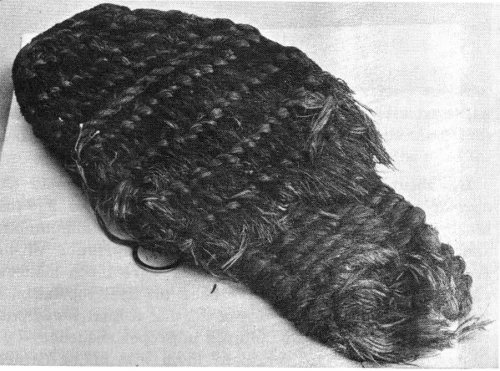
Rope sandal found in an eastern Oregon cave. One of a pair of 300 pairs found in this cave. 9035 ± 325 years old.
Carbon-14 is by far the most widely used method of measuring geologic time. It has become the mainstay of archeology and geology for studies of events of the past 50,000 years or so, and also has wide applications in climatology, ecology, and geography. It would be difficult to pick out the most significant example of the use of this method, but one important contribution has been in study of the early inhabitants of North America. With the aid of ¹⁴C it has been possible to date human living sites from many points in the western United States. The first appearance of these sites, about 11,500 years ago, apparently coincided with the time when a land bridge was open from Asia to America over what is now the Bering Strait. An ice-free passage extended from this bridge through present-day Alaska and western Canada to the United States. This may have been the route taken by the first immigrants to America—a population of mammoth-hunters, who made the characteristic flint Clovis arrow and spear points.
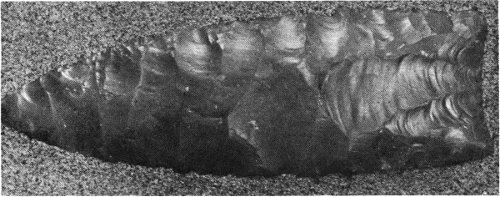
A Clovis arrow point chipped from flint by the earliest men on the American continent. The photograph is actual size.
By about 11,000 years ago, these Clovis people had spread across the area of the United States and into Mexico. It may have been they who killed off the mammoths and then gradually assumed the characteristics of the Folsom culture. The Folsom people were bison-hunters, and long were thought to have been the first population in America. It was with the use of ¹⁴C that it finally was possible to place these two cultures in proper sequence—the Clovis first—and to correlate them with major natural changes, especially the advance and retreat of glaciers across the continent.
THE LONG-LIVED CLOCKS
All other practical age-determination schemes are based on a few long-lived isotopes, with half-lives relatively near the age of the earth (4.5 AEONS). They are:
| Table III | |||
|---|---|---|---|
| Isotope | Emits | Decays to | Half-life |
| Uranium-238 | 8 ALPHA PARTICLES[10] | Lead-206 | 4.51 aeons |
| Uranium-238 | Spontaneous fission | 2 Fragments | 10 million aeons[11] |
| Uranium-235 | 7 Alpha particles | Lead-207 | 0.713 aeons |
| Thorium-232 | 6 Alpha particles | Lead-208 | 14.1 aeons |
| Rubidium-87 | Beta particle | Strontium-87 | 4.7 aeons |
| Potassium-40 | Electron capture | Argon-40 | 1.3 aeons |
| ...... | ...... | ...... | ...... |
| Rhenium-187[12] | Beta particle | Osmium-187 | 40 aeons |
It is apparent that Table II on page 6, showing the long-lived radioactive nuclides, is much longer than the list of the seven shown here that are actually useful in practice. Some of the nuclides that are theoretically available are useless on a practical basis, because they are so rare in nature. Many others cannot be used for reasons that are fundamental to the whole process of nuclear age determination by “whole hourglass” (that is, parent-daughter) methods. Let’s look at these reasons.
These methods are based on closed systems in which the daughter products of the radioactive decay are locked with the parent material from the beginning of the system, and nothing is added or removed thereafter. To state it in terms of our analogy, the hourglass must be in perfect working order—no leaks or cracks permitted.
There is another fundamental requirement: At the beginning, the bottom part of the hourglass must be empty. 20 If some sand were already in the bottom at the start, we would mistakenly be led to conclude that the time elapsed was longer than it actually was. That necessity places a severe limitation on the type of system we can use.
Consider, for example, the decay of potassium-40 into calcium-40. Measuring this process is perfectly suitable from the point of view of half-life, but the daughter product is identical with the most common isotope of ordinary calcium. And calcium is present everywhere in nature! Even the purest mineral of potassium, sylvite (the salt, potassium chloride), contains so much calcium impurity that the RADIOGENIC daughter calcium, produced by the decay of potassium in geologic time, is negligible in comparison. We can say that the bottom of this potassium-40 hourglass has been stuffed with so much sand from the very beginning that the few grains that fall through the waist are lost in the overall mass. This demonstrates that schemes involving the decay of a relatively rare nuclide into a relatively common one are not usable. Natural geochemical separations of elements are never perfect, anyway.
Similarly, the decay of any of the RARE EARTH elements into other rare earth elements is not particularly helpful, because the rare earths are so similar chemically they tend to travel together when they move in nature.[13] Wherever the parent isotope goes, the daughter tags along.
The Rubidium-Strontium Clock
The decay of rubidium-87 (⁸⁷Rb) into strontium-87 (⁸⁷Sr) is perhaps the most useful scheme for geologic age determination. The same problem shows up here, but at least there is a way out of the wilderness. It is not exactly simple, but a consideration of it is fundamental to understanding the process of nuclear dating. The figure shows patterns from mass spectrometer charts; each peak represents an isotope of strontium, and the height of every peak is proportional to the relative abundance of that isotope. 21 In the figure, A shows the mass-spectrum of a rock or mineral containing COMMON strontium (which is a mixture of several isotopes). The peak of ⁸⁷Sr is small compared to the others. B shows the mass-spectrum of strontium from an old rubidium-rich mineral CRYSTAL, drawn to the same scale, as far as the nonradiogenic isotopes, ⁸⁴Sr, ⁸⁶Sr, and ⁸⁸Sr, are concerned. The ⁸⁷Sr peak in this spectrum is obviously larger than in the common strontium in A. This is because this isotope is radiogenic and has been accumulating from the decay of rubidium since this crystal was formed.
The question we must answer is: How much of this ⁸⁷Sr was formed from ⁸⁷Rb decay and how much originally was present in the crystal as an impurity? If the amount of this ORIGINAL strontium is not too large, the problem can be solved by simple arithmetic.
First, we must find a good sample of common strontium—that is, ordinary strontium, the kind shown at left in the figure. We cannot require that this strontium be entirely uncontaminated by radiogenic strontium, because all strontium is more or less contaminated. What we need is strontium contaminated to just the same extent as the strontium that was taken as an impurity into the closed system when it first formed. In geological specimens such a material is usually available.
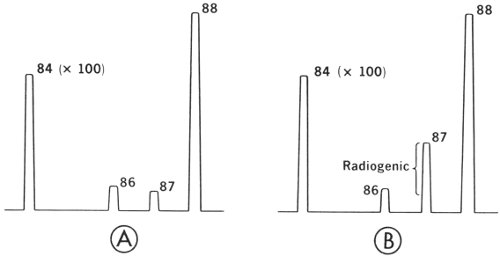
Drawings of mass-spectrometer charts showing the isotopic spectra of two kinds of strontium: (A) common strontium and (B) strontium from an old mineral rich in rubidium. (See page 32 for photo of a mass spectrometer.)
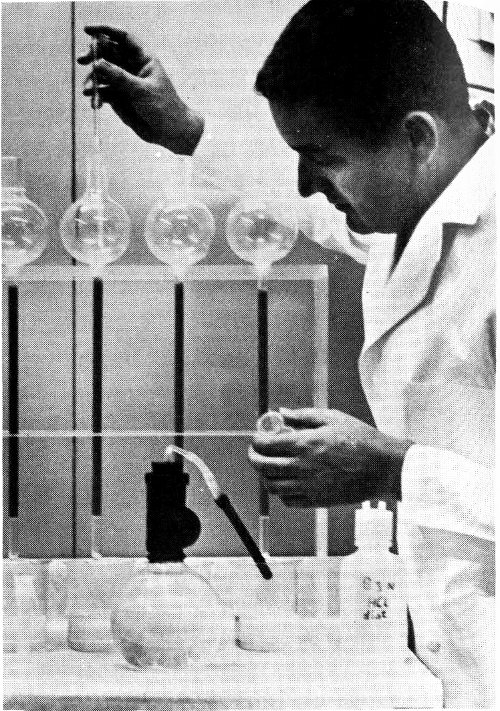
Rubidium-87 and strontium-87 fall on the same spot in the mass spectrum. Therefore, rubidium must be separated chemically from strontium before the strontium can be analyzed in a mass spectrometer. It is done with ion-exchange columns. Four of them are shown in this photograph. The author of this booklet is adding a sample, dissolved in a few drops of hydrochloric acid, to the second column.
Let us take as our closed system a mica crystal in a mass of granite. Mica contains a fair amount of rubidium, and it retains its radiogenic strontium very well. Furthermore, mica crystals are often associated or even intergrown with the slender, rod-shaped crystals of a mineral called apatite—a phosphate of calcium. It is justifiable, on the basis of geological knowledge, to say that the mica and the apatite grew at roughly the same time and thus presumably from the same liquid medium that became granite when it later solidified. Now strontium is geochemically similar to calcium, and some strontium will have gone into the apatite crystal in place of calcium. Apatite contains no alkalis—hence apatite will have virtually no rubidium (which is an alkali) in it to contaminate the ⁸⁷Sr. Consequently, when we find apatite in an old granite, we know the apatite will still contain the kind of common strontium that was taken into the mica crystal when it grew originally.
We can separate the apatite from the granite by standard mineralogical techniques, extract the strontium from the 23 apatite chemically, and analyze it on a mass spectrometer to obtain the isotopic spectrum—the relative amount of each isotope that is present. We can then perform the same isotopic analysis on the strontium extracted from the mica, and subtract the original (apatite) strontium from the total (mica) strontium, to obtain the radiogenic component or daughter product. (See page 32 for details of this method.)
Obviously, there is a certain error associated with every isotopic analysis, so such a calculation is meaningful only when the radiogenic component is large compared with the error in the measurement of isotopic abundance. When one large quantity must be subtracted from another large quantity to obtain a small difference, there is an obvious limit to how much one can trust the result. The absolute accuracy in measuring strontium isotope abundance is a few tenths of 1%, using the best mass spectrometers now available. In practice, one can trust a calculated age for a specimen only when the ⁸⁷Sr is as little as about 5% radiogenic. The results do not mean much when only 1 or 2% is radiogenic.
A sample of granite being made ready for crushing and mineral separation.
The Uranium Fission Clock
When a neutron strikes the nucleus of uranium-235 (²³⁵U) or plutonium-239 (²³⁹Pu), it may cause the nucleus to split into two roughly equal fragments, releasing neutrons and energy. This is the well-known process of neutron-induced fission, the method in which nuclear energy is produced in both reactors and bombs.[14] The most common uranium isotope, ²³⁸U, also breaks up by fission, but does so all by itself, without the need for any external neutrons. That process is spontaneous fission and it goes on at random, very much like radioactive decay. It is a relatively rare process and the fission half-life is long—about 10 million aeons (10¹⁶ years). That means that only about one spontaneous fission occurs in uranium-238 for every 2 million alpha decays. That is enough to make a useful clock, however, because ²³⁸U is present almost everywhere. (See Table III on page 19.)
Imagine an atom of ²³⁸U in some mineral. When the atom suddenly fissions, it breaks in two with considerable energy, and the two fission fragments rip like cannon balls through the surrounding crystalline structure in opposite directions, creating havoc along the way. They travel a distance something like 10 microns (4 millionths of an inch) before they are finally slowed down and stopped by all their collisions with other atoms. Each fragment’s path remains behind as an intensely damaged tube through the crystal.
The process was known for a long time before anyone was able to find these fission tracks (the damaged tubes) in the crystals. Finally, about 1960, three young physicists, R. L. Fleischer, P. B. Price, and R. M. Walker, working at the General Electric Research Laboratory, fell upon the idea of etching freshly broken surfaces of crystals with acid. They reasoned that a region so intensely disturbed by the passage of a fission fragment should be etched more easily and deeply than the undisturbed surrounding crystal. That idea turned out to be correct, and fission tracks have now been found in almost every common mineral (since almost all minerals contain small amounts of uranium).
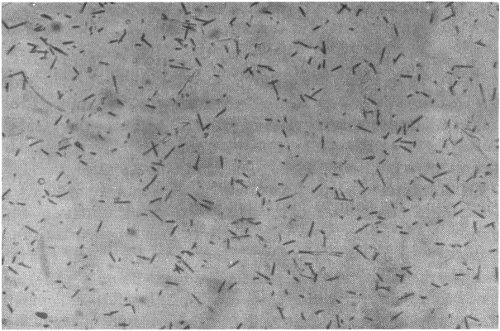
Tracks of uranium fission from a fossil antelope bone fragment from Hopefield, Cape Province, South Africa.
The fission clock method works this way: A cleavage face or a polished surface of a crystal or glass fragment is etched with a suitable solvent. Different acids work best for different materials, and a suitable procedure must be developed especially for each substance. The etching brings out the fission tracks so they can be seen (usually as little conical pits) and counted under a microscope.
After this, the sample is exposed to a known amount of slow neutrons[15] in a nuclear reactor. New fissions are produced, but this time only in ²³⁵U (which is present in all natural uranium in the proportion of 1 atom of ²³⁵U to 137.7 atoms of ²³⁸U), because slow neutrons do not produce fissions in ²³⁸U. After the neutron irradiation, the same surface is etched again, and the new tracks counted. The old tracks, having been etched twice, now appear larger and thus can be distinguished from the new ones that were caused by ²³⁵U fission.
The rate at which ²³⁸U decays by fission, λf, is known, as are the rate it decays by alpha decay, λα, and the total number of slow neutrons, n, to which the sample was exposed in the reactor. The age of the crystal or glass can then be calculated:
| 1 |
| λα |
| nNs |
| Ni |
- where
- ln = the natural logarithm (log to the base e),
- Ns = the number of atoms in the sample.
- Ni = the number of atoms of ²³⁵U in the irradiated sample,
and the constant has the value:
| λα × 582 × 10⁻²⁴ |
| λf × 137.7 |
Fission-track dating is a brand new technique, still only partly developed. It has enormous range and is applicable to numerous minerals; these advantages imply that it is likely to become very useful.
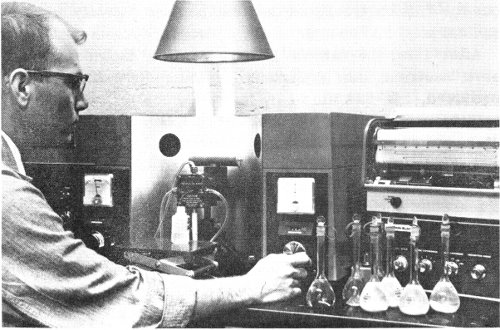
An atomic absorption spectrophotometer is used to measure the amount of potassium in samples of mica dissolved in acid.
Plumbology
The most complicated and therefore probably the most interesting decay scheme of all is the decay of uranium to lead, discovered well over half a century ago and still intensively studied. There are several reasons for the interest.
First, uranium and lead are geochemically separated to a high degree, not only on the small scale of an ore deposit but also on the scale of the earth as a whole. Second, natural uranium has two isotopes with half-lives that are neither too long nor too short to be useful (the greater half-life almost exactly equaling the age of the earth), and these half-lives differ from each other by a factor of about 6.3. That leads to very important consequences, as we shall see. Third, uranium and lead are both common, and techniques are available for extracting them in measurable quantities from almost any natural material.
As a consequence of these happy circumstances, the study of uranium and lead has contributed a great deal to understanding the earth’s history and the processes that go on inside it. F. G. Houtermans, one of the great pioneers in this study, jokingly called the method PLUMBOLOGY, and it seems a useful name.
THE AGE OF THE EARTH
The greatest achievement of the “plumbologists” has been the calculation of the age of the earth, first proposed by Houtermans, a German physicist, and independently by Arthur Holmes, a British geologist, in 1946 and finally perfected by C. C. Patterson in 1953. It is actually a rather simple calculation, although the way to discovering it was far from easy. Before we look at it in detail, however, let’s consider some basic assumptions and explain what is meant by “the age of the earth”.
From studying the mechanics of the solar system, scientists have become reasonably certain that the earth and the other planets and their satellites all were formed in a common process in a relatively short period of time, geologically speaking. Perhaps it took a dozen million 28 years or so, but compared to the time that has elapsed since, that is a twinkling. At some time soon afterwards, the earth became molten, or at any rate fluid enough to allow much of its iron to settle toward the center to form the earth’s core. Similar cores presumably formed in other planets. As the iron went down, it took some lead with it, and as the silica went up, uranium followed it toward the surface, because of the chemical affinity between these kinds of elements. In the present earth, we have found, almost all the uranium is concentrated in the top layer, or crust, which is only about 25 miles thick under the continents and even thinner under the oceans.
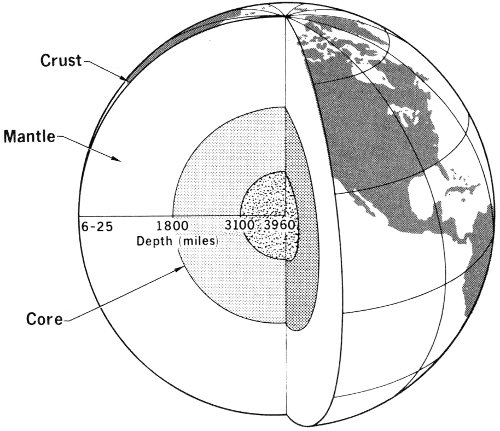
Internal structure of the earth. The central core is probably an alloy of iron and nickel, surrounded by a mantle of less dense silicate material, with a thin crust of still lighter silicates.
The time of this early and relatively rapid separation of uranium and lead on a worldwide scale is the event that plumbologists can determine, and the period since then is what they mean by “the age of the earth”. When Houtermans first wrote about it, he called it “the age of uranium”.
How is this done? We have said that one of the isotopes of uranium, ²³⁵U, decays faster—about 6.3 times faster—than the other, ²³⁸U. They decay into two different isotopes of lead. Therefore, if we can determine the isotopic composition of average ordinary lead in the earth’s crust today, and if we can somehow obtain a sample of the kind of lead that is locked in the earth’s core, we can calculate 29 how long it took to change the PRIMORDIAL lead (like that in the core) into present-day lead in the crust by the gradual addition of radiogenic lead—lead that has resulted from the decay of uranium. Now, someone might logically ask, “Isn’t it necessary to know also the actual amount of uranium involved in the process, and isn’t this difficult to determine?” It turns out to be a remarkable aspect of the Holmes-Houtermans calculation that the uranium-concentration terms cancel out in the equations and only the ratio of the isotopes and their decay constants need be considered. These are all known accurately.
Next, we must decide just what is average present-day lead? It isn’t enough to go to a lead mine and get a sample, because, unfortunately, leads from different mines have widely varied isotopic composition—that is, a different mixture of four natural isotopes, ²⁰⁴Pb, ²⁰⁶Pb, ²⁰⁷Pb, and ²⁰⁸Pb—as a result of their geologic histories. No, lead samples from a mine won’t do. However, geologists have been able to separate lead from recent marine sediments, obtained from the ocean bottom, far from land. These are of uniform composition, and are good samples of what the world’s rivers bring into the ocean. Other useful samples can be found in plateau basalts, which are enormous bodies of dark volcanic rock that make up the bedrock in many parts of the world. The lead from these basalts is isotopically very much like the lead in the oceans.
Very well, but how about the lead from the core? Where can we hope to find a sample of it? It turns out to be easier than you might think. Astronomers believe it highly probable that most meteorites are fragments of a former planet that broke up for reasons that are not entirely clear. It is pretty definite, however, that this protoplanet (or these protoplanets, for there may have been more than one) had an iron core, and this core (or these cores) is the source of the iron meteorites sailing around in space. A large meteorite hit the earth not too long ago (geologically speaking) and caused the Meteor Crater near Canyon Diablo in Arizona.
Examining ocean-bottom sediments obtained by lowering a tube-like instrument that brings up a long rod-shaped “core”, prior to nuclear age determination of the sample.
Many fragments of the meteorite iron have been found around the crater, and it is reasonable to assume that this is the kind of iron we would expect to find in the core of the earth. Like the core iron, it is mixed with a little lead, which can be isolated and analyzed in a mass spectrometer for its isotopic composition. This lead is found to be much less contaminated with radiogenic lead, and hence is much more primitive than the oldest leads found on earth. Thus, meteorites presumably are as close as we can get to true primordial lead—the lead of the time when the earth (and the protoplanet) first formed.
Once these measurements were available, it was easy to write the Houtermans equation for present-day and primordial leads in this way:
(
|
||||
(
|
| (eλ238t - 1) |
| (eλ235t - 1) |
The present ratio of ²³⁸U to ²³⁵U is 137.7.
- e = the base of natural logarithms
- λ = the DECAY CONSTANT of each isotope of uranium
- t = the age of the earth.
Substituting the best experimental lead isotope ratios into the equation and solving for t, Patterson was able to calculate that the earth is 4550 million years (4.55 aeons) old. Subsequent calculations based on other procedures generally have confirmed that result.
Analytical Techniques
Each method of nuclear age determination involves a different sequence of sample preparation. Wood, peat, charcoal, bones, or shells are cleaned for carbon-14 dating in order to remove every trace of possible contamination by modern carbon as well as extraneous old carbon. Rocks are crushed and ground, minerals are separated according to what is needed in any particular study, and the desired elements are extracted and separated by chemical procedures. Often there may be several different ways of doing the same thing; different laboratories use different procedures. In every case, however, long and complicated procedures must be followed before results are obtained from which an age can be calculated. There is no such thing as a black box into which you can throw a rock and read its age on a dial!
Of all the elements that are part of the useful parent-daughter systems, only potassium is common enough to be analyzed by conventional chemical techniques. All the other elements, especially the radiogenic ones, are present in such small quantities that special processes had to be developed to measure them. The most valuable and generally used process is called ISOTOPE DILUTION.
Isotope Dilution
This is a process for analyzing an unknown material by incorporating uniformly into it a small amount of a radioactive test substance and determining how much the tracer radioactivity is altered by dilution in the original material.
It works like this: Let’s say that we have an unknown number of atoms, x, of a given element. The normal isotopic composition of this element is accurately known, as it is for most elements, and the ratio of two of its isotopes can be expressed as A/B. We now add to x a known (but usually smaller) amount, c, of the same element. This quantity has a drastically different isotopic ratio, A′/B′. We mix x and c thoroughly together. The ratio A′/B′ can have almost any value, but must be different from A/B and we must know exactly what it is. (There are many ways of determining this chemically, or we can use a sample isotope of known composition obtained from the U. S. Atomic Energy Commission’s Oak Ridge National Laboratory at Oak Ridge, Tennessee.) The substance added is known colloquially as the SPIKE.
After the original material and the spike are thoroughly mixed we have:
x(A/B) + c(A′/B′) = (x + c) (A″B″)
in which A″/B″ will be the ratio of the two isotopes in the mixture. With this information in hand, we can perform any chemical purification or transfer process with the material (see photo on page 22), without having to worry about loss. (Even if 90% of the material should be lost in some operation, the isotopic composition would not be changed, and that is all we are interested in.) Now we can place the material containing the isotopic mixture in a MASS SPECTROMETER, which will determine the ratio A″/B″. When we have that, we may substitute the value of A″/B″ in the equation and quickly calculate x, the unknown concentration of atoms in the original sample.
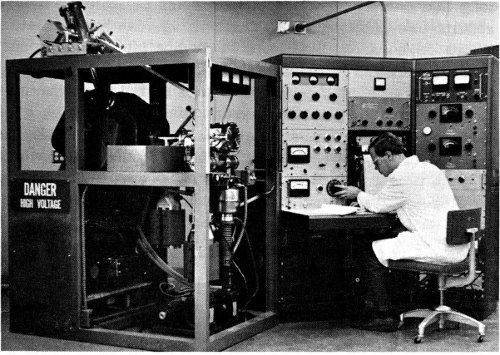
A large (12-inch) mass spectrometer (at left) in use. Electronic equipment (right) charts results (see page 21).
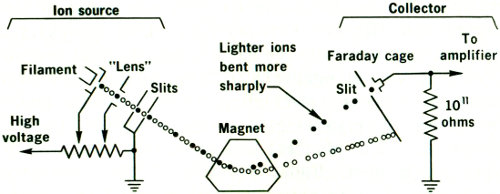
Essential parts of a mass spectrometer. Atoms to be analyzed are changed to ions in the source. Then the ions are accelerated by high voltage, deflected in a magnetic field according to their mass, and the intensity of the separated beams is measured in the collector.
Mass Spectrometry
The mass spectrometer measures isotopic abundances using a magnetic field to sort electrically charged particles into groups according to their masses. It works this way: A small drop of material to be analyzed is placed on a metal filament and dried. The filament, in its holder, is placed inside the mass spectrometer, and heated electrically in a vacuum, like the filament in a light bulb. As the wire begins to glow, some of the sample begins to radiate, or “boil off”, losing an electron or two in the process. In other words, some of the atoms will be changed into positive IONS.
An alternative method is to introduce the sample material into the vacuum chamber in the form of a gas (like argon, for example), and then bombard the gas with electrons 34 streaming from a hot filament. The electron stream will knock some electrons off the gas molecules and this also will produce positive ions. Either process of ion production is satisfactory, depending on the problem to be tackled, but the mass spectrometers for the two methods are naturally quite different.
Whichever way the ions were produced, they are next exposed to a strong electric field, accelerated, and electrostatically focused into a beam. These charged particles are directed into a magnetic field between the pole faces of an electromagnet. The magnet does the analyzing by the principle of magnetic deflection that was known to André Ampere and Michael Faraday more than a century ago. Any moving electric charge has a magnetic field associated with it. This field interacts with the field of the analyzing magnet to impress a deflecting force on the charge. The force acts at right angles to the direction the charge travels and also at right angles to the direction of the impressed magnetic field. The pull of this force depends only on the electric charge and the speed of each particle: A light single-charged particle will be deflected more than a heavier particle with the same charge. In this way, the ions in the beam are sorted out into a number of separate beams, each made up of particles of the same charge/mass ratio. Each beam contains one isotope of the original material, because isotopes differ on the basis of their mass. By adjusting the current in the electromagnet we can direct these separate beams into a “collector” and electrically measure their intensity one by one. This gives the relative abundance of the separate isotopes in the sample.
Minerals That Can Be Dated
Measuring age by one of the long-lived radioisotopes requires a closed system. Usually this is some kind of crystal formed in a period of time that is short, compared to the time that has elapsed since, and that has remained unchanged since it formed. Specifically, neither the parent isotopes can have been added nor the daughter isotopes removed by any process other than radioactive decay.
The earth is a dynamic system, however. Things are always changing and moving—not very rapidly, perhaps, but fast enough, in geologic time, to raise mountains and shift oceans. Solutions are moving around, dissolving something here and depositing it again somewhere else. Temperatures are changing as one place is denuded by erosion and another area buried under layers of sediment. Under such conditions, few systems remain closed. It is perhaps surprising that we find any closed systems at all. Let us look at a few that are known to be reliable. (They are listed in Table I on page 4.)
Potash Feldspar
In the early 1950s, when the potassium-argon (parent-daughter) method was being developed by scientists at the University of Chicago, it was thought that the potash-bearing variety of the mineral feldspar would be an ideal closed system, because it was usually optically clear and free of flaws. This widely shared, logical, and perfectly scientific deduction soon turned out to be quite wrong. The scientific workers discovered that when feldspar and mica from the same rock (and thus of the same age) were analyzed side by side, the mica always came out older! Investigation showed that feldspar “leaked” argon (lost some of its radiogenic argon) even at room temperature, but the mica retained all or nearly all of the argon that had been generated in it.
Mica
With the development of the rubidium-strontium (parent-daughter) method by L. T. Aldrich and his co-workers at the Carnegie Institution of Washington, came the realization that mica was also very useful for this analysis, for it usually contains ample rubidium and not much original strontium that would mask the presence of the radiogenic strontium. As a result, mica, especially black mica (the mineral biotite), has enjoyed great popularity as a good and easy-to-find closed system.
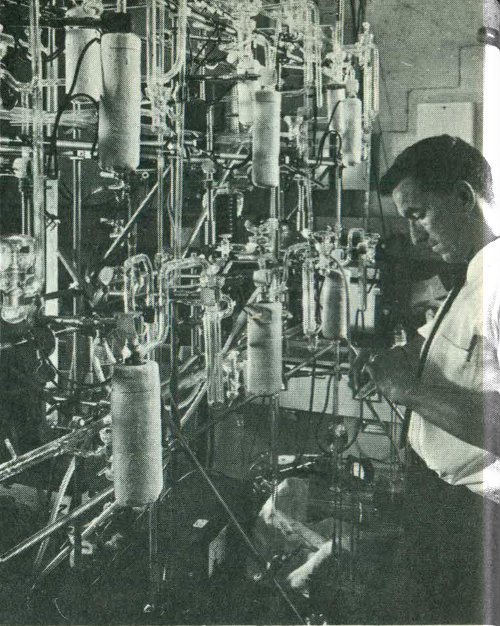
A scientist making adjustments on an “argon train”, a maze of glass tubing in which argon is released from minerals and purified for analysis.
Everything has its limits, and mica is no exception: Even mica tends to leak argon at elevated, but still relatively low (geologically speaking), temperatures. These effects also depend on pressure and other factors, not all of which are well known; these elevated temperatures, pressures and other conditions of course act to some extent on all rocks buried in the earth’s crust. It is known that at only about 300°C at moderate pressures argon is leaked from mica faster than it is being generated in it by the decay of radioactive potassium. The temperature needed to cause the rapid loss of strontium from mica is not much higher. Mica, especially biotite, will recrystallize and lose all its radiogenic constituents (argon and strontium) at temperatures where many other minerals show little or no change.
That means that we cannot always rely on mica to give the date of the original crystallization of a rock—the time when it cooled from a molten state. Instead, mica will tell us when the rock last cooled from, say, several hundred degrees centigrade, regardless of what may have happened to the rock before that. The mica may have been reheated as a result of being buried under a few miles of sediment, for example. The mica will show when the rock last cooled—in other words, when it came up again.
Low-Strontium Feldspar
In spite of early disappointments with potash feldspar for argon dating, some of it is useful for rubidium-strontium procedures. It all depends on how much original strontium the potash feldspar contains. Most feldspars, unfortunately, contain far too much, but rapid screening by X-ray fluorescence or flame photometry methods can weed these out and identify specimens low enough in original strontium to be useful. Otherwise, feldspar is an excellent closed system for rubidium and strontium; it remains closed even at temperatures high enough to melt many other minerals. It is not affected at all by the same degree of heating that will drive argon out of biotite. The rubidium-strontium age of feldspar usually comes close to the time of original crystallization of the rock.
Obviously, here is a geologically important tool. If we find feldspar and biotite in one rock, and if feldspar, tested by the rubidium-strontium method gives the same age as biotite tested by potassium-argon decay, then we can say with confidence that the rock has not been reheated since shortly after it crystallized. Conversely, if the biotite comes out much younger than the feldspar, we can be sure that something has happened to this rock long after it first crystallized. Such information is not only valuable to pure science—it can also be useful in locating areas favorable for ore prospecting and in other practical ways.
Zircon
Another very interesting mineral is zircon (a silicate of zirconium), one of the accessory minerals found in small quantities in many crystalline rocks. Zircon usually occurs in very small grains and is heavy and hard, so that it can be separated from the other rock without much difficulty, even though it may take 100 pounds of rock to supply a gram of zircon.
Zircon usually contains a fair amount of uranium and very little lead. It holds radiogenically produced lead well, even at relatively high temperatures. But that is not all. Even if some of the lead is lost, there is a mathematical way of correcting for it. This technique is called CONCORDIA ANALYSIS 38 and was developed by G. W. Wetherill, a physicist then at the Carnegie Institution of Washington. It is based, again, on the fact that natural uranium has two long-lived isotopes—²³⁸U and ²³⁵U—and that the lighter one, ²³⁵U, decays faster than the heavier. The daughter products of both uranium decay processes are isotopes of the same element, lead—²⁰⁸Pb and ²⁰⁷Pb, respectively. Heavy isotopes are not separated to any significant degree by chemical processes, so that if radiogenic lead has been lost from a system for any reason, the other lead isotopes also will have been lost in whatever proportion they were present originally.
If we plot a graph of the radiogenic ²⁰⁶Pb/²³⁸U ratio against the radiogenic ²⁰⁷Pb/²³⁵U ratio for concordant (closed) systems of all ages, we obtain the curved line shown in the figure below. The curve is the locus of all concordant U-Pb ages and is called Concordia. Then if we test two or more particular zircons of the same age that have lost different amounts of lead, at about the same time, the plot of their ²⁰⁶Pb/²³⁸U ratios against their ²⁰⁷Pb/²³⁵U ratios will fall on a straight line that is a chord of the Concordia curve. The upper intersection of this chord with the curve then will mark the true age of the zircons. This is an elaborate technique utilizing difficult chemical procedures, but it has proved invaluable in solving some important geologic problems.
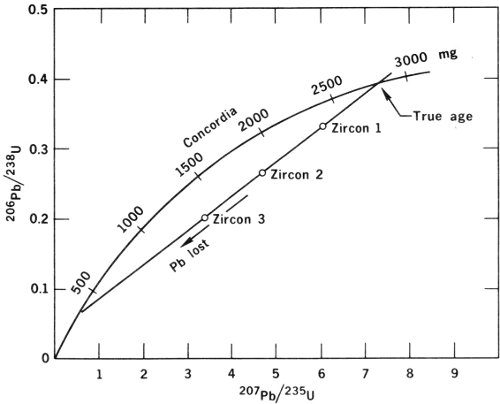
The Concordia curve offers a useful way of analyzing results of age determinations on the mineral zircon.
Hornblende
The mineral hornblende provides another useful system. Hornblende is a complex silicate of sodium, calcium, iron, magnesium, and aluminum, and usually contains a few tenths of 1% of potassium. It is unusual in that it tenaciously retains its radiogenic argon, even at relatively high temperatures.
Sanidine
Still another good system is the rare feldspar, sanidine, which is excellent for both potassium-argon and rubidium-strontium age determination. Sanidine usually is found in volcanic ash falls and has been important in the establishment of the geologic time scale, as we shall see.
Whole Rocks
Finally there is still another way of obtaining a closed system by using the whole rock, not just a crystal of a single mineral within it. A large body of granite or similar rock may contain a number of minerals, some or none of which may be closed systems. Yet as long as this body of rock remains impermeable to solutions (which in nature means mostly to water), no substance will be able to move very far in it because diffusion in solids is so slow. Consequently it will remain a closed system, as a whole, regardless of what happens to the individual mineral grains.
If we take a piece from near the middle of this body of rock and if this piece is much larger than the largest constituent grain in it, then we have a fair sample of a closed system—the whole rock. The only difficulty arises from the fact that few rocks are sufficiently impermeable to solutions to retain argon, and many rocks contain so much common strontium that rubidium-strontium analysis 40 is impractical. Still, we can use the rapid survey methods as for feldspar, selecting the few rocks that would be useful. This work has been done frequently, and the results have been fruitful for rubidium-strontium analysis. The whole-rock rubidium-strontium age dates the time when the rock became impermeable.
SOME INTERESTING RESULTS
The Old Man from Olduvai
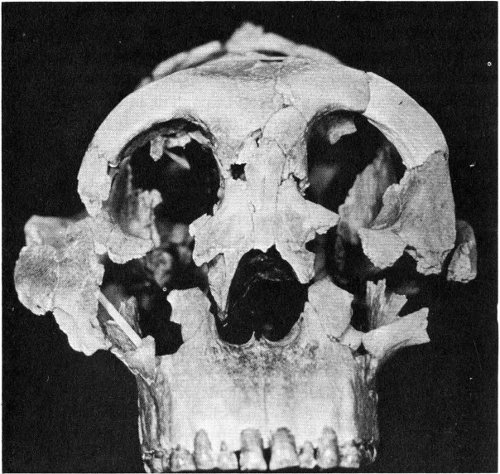
Fossil skull of Zinjanthropus, nearly 2,000,000 years old, discovered in 1959 by Dr. L. S. B. Leakey in Olduvai Gorge. Accurate dating of this earliest human ancestor was possible by using the potassium-argon method.
One of the most talked-about age measurements in recent years was the determination of the unexpectedly great age of fossil ancestors of man, found by the British 41 anthropologist, Dr. L. S. B. Leakey, in Olduvai Gorge in Tanzania. The measurements were made by Garniss H. Curtis and Jack F. Evernden at the University of California in Berkeley by the potassium-argon method. The age came out a little less than 2 million years, about twice as old as it “should be” in the view of many scientists. Human remains of such great antiquity had never been found before, and much doubt was raised about the validity of the figures.
Time periods as short as two million years are not easy to measure by potassium-argon. The amount of argon produced in that time is extremely small, and contamination by argon from the air is a serious problem. Still, the measurements were repeated, the rocks were studied again, and the result did not change: The fossils were still about 2 million years old.
In cases like this, one tries to find some other method to check the results in an independent way. After many attempts it was discovered that the same rock strata dated by potassium-argon also contained some pumice—a porous volcanic glass—and that this glass was suitable for uranium fission-track dating. The measurements were made in the General Electric Research Laboratory. What was the result? Just about 2 million years!
When such altogether different techniques give the same number, one can have some confidence that the number is exact. It would be difficult to imagine a disturbance in nature that would cause these unrelated methods to give the same wrong number—in both cases by a factor of two. The double check simply means the Olduvai man is 2 million years old. There is not much doubt about it.
The Geologic Time Scale
Much of historical geology is based on a relationship called the LAW OF SUPERPOSITION. This simply means that when some rock formation was placed on top of some other formation by natural processes (sedimentation or volcanic eruption, for example), the layer on top must be younger than the one on the bottom. Such a conclusion may now seem obvious, but the concept was not even expressed until the very end of the eighteenth century and was still a 42 matter of scientific controversy when Abraham Lincoln was a boy. It was the law of superposition, however, that led the early geologists to establish the first geologic time scales and to realize the enormous extent of geologic time.
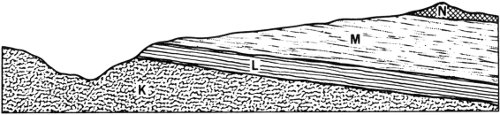
Diagram illustrating the law of superposition. Each rock bed is younger than the strata under it.
In essence the system of establishing age by this concept is this: Somewhere a large and easily recognized layer of sedimentary rock was known. It had a characteristic color, texture, gross composition, and overall appearance. Let us call it bed M. This bed could be traced across the countryside until a place was reached where it could be seen that bed M rested on another, different layer of rock, which we might call bed L. Bed L could also be traced some distance and ultimately could be observed resting on a still different stratum, which we shall call bed K. Some of these beds had fossils in them, and it was eventually realized that rocks with the same kinds of fossils are of the same age, even though they may differ in other respects—in color or composition, for instance.
If bed M was followed in another direction, perhaps a point was reached where it dipped down a little, and here, was found still another layer—call it bed N—on top of M. Obviously, the sequence of beds from oldest to youngest was K-L-M-N. Their relative ages were now established. Over the years, hundreds of geologists described various rock layers and identified the fossils in them. By the middle of the nineteenth century, this “layer-cake” structure of sedimentary rocks was well-known in western Europe. (One may say, parenthetically, that America was geologically a vast unknown at that time. Today we know much more about the geology of Antarctica than anyone a hundred years ago knew about the geology of the United States.)
A system of nomenclature for the “layer-cake” was developed and refined. Gradually this nomenclature was accepted internationally. Long-range correlations between beds of the same age, distant halfway around the globe from each other, were made possible as the science of PALEONTOLOGY developed. The relative age of almost any rock containing even poorly preserved fossils could be determined anywhere in the world with precision. That is, the age of rock layers in relation to one another was known. But the real age—the absolute age—remained unknown until knowledge of radioactivity provided the necessary clocks.
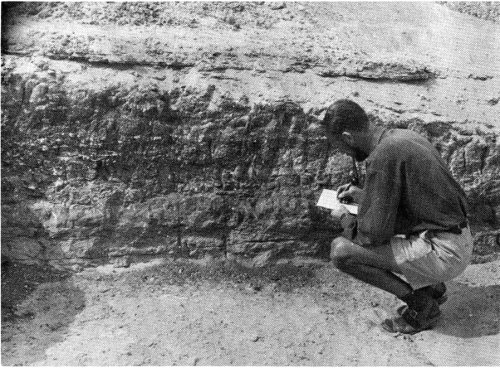
A geologist carefully maps the layers of soil in which ancient flint tools have been found. Exact correlation of the tool-bearing strata with material datable by carbon-14 analysis must be accomplished before the age of the tools can be determined.
Even this process wasn’t entirely without problems. The difficulty lay in the fact that ordinary sedimentary rocks (shale, sandstone, and limestone) cannot be dated by the usual nuclear methods because they present no suitable closed systems. Only some volcanic sediments can be 44 reliably dated by the mica, feldspar, and zircon they contain; but these ancient ashfalls are rare, usually are only a few inches thick, and are not easy to identify at the surface because they weather quickly to clay. Only about a dozen volcanic beds have been accurately dated in North America. The time points they established are mainstays of the present geologic time scale, but they have had to be supplemented by indirect information.
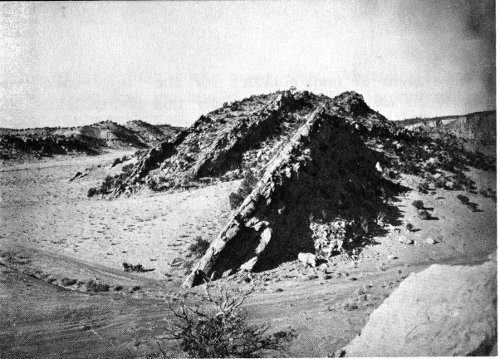
Steeply dipping sandstone strata from the Cretaceous Period near Gallup, New Mexico. This photo, taken in 1901 (note the horse-drawn wagon), was made on an early government survey of Western lands.
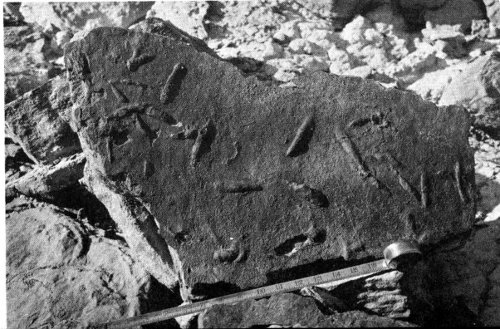
Fossils of bird tracks in sandstone in Death Valley, California.
The most important of these indirect time points are furnished by what geologists call BRACKETED INTRUSIVES. It often happens in geologic history that a mass of rock becomes molten at a great depth and forces its way up through several layers of sedimentary rocks. The sedimentary layers are usually bent and twisted (folded) by the upthrust, and where the cooler rock comes in contact with the molten mass, cooler material is burned (recrystallized). Geologists call that process CONTACT METAMORPHISM because the sedimentary rock forms are changed, or metamorphosed, to have another form or composition. Contact-metamorphosed rocks, in spite of the damage they have suffered, may contain recognizable and accurately datable fossils. Thereby the metamorphic rock establishes a lower limit for the age of the intrusion: It must be younger than the fossils in the youngest of the metamorphic rocks it touched.
Now on top of the intrusive rock, we may find another sedimentary rock, deposited on top of the intrusive after it cooled and was exposed by the erosion of overlying materials, perhaps millions of years later. This new sediment may also contain fossils and thus furnish an upper limit for the age of the intrusion. The measured age of the intrusive rock thus can be used to set upper and lower limits on the absolute ages of the two sediments. If we are lucky, the two sediments will bracket a relatively short interval, making our measurement quite precise.
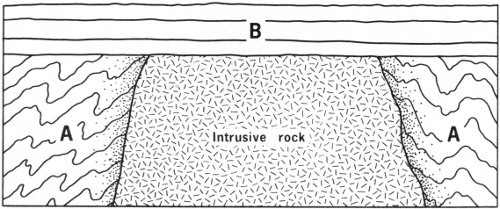
Idealized sketch of a bracketed intrusive. The igneous (molten) rock must be younger than the sedimentary rock (A) it intrudes, and older than the rock (B) that overlies it. The relative age of the sedimentary beds is known from their fossils.
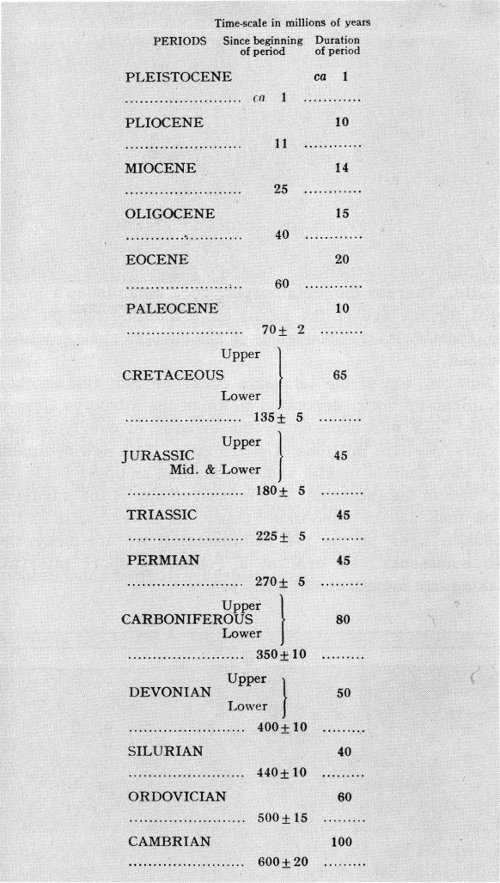
Facsimile reprint of the famous time scale proposed by Arthur Holmes in 1959.
| Time-scale in millions of years | ||
|---|---|---|
| PERIODS | Since beginning of period | Duration of period |
| PLEISTOCENE | ca 1 | |
| .... | ca 1 | .... |
| PLIOCENE | 10 | |
| .... | 11 | .... |
| MIOCENE | 14 | |
| .... | 25 | .... |
| OLIGOCENE | 15 | |
| .... | 40 | .... |
| EOCENE | 20 | |
| .... | 60 | .... |
| PALEOCENE | 10 | |
| .... | 70 ± 2 | .... |
| Upper } | ||
| CRETACEOUS | 65 | |
| Lower } | ||
| .... | 135 ± 5 | .... |
| Upper } | ||
| JURASSIC | 45 | |
| Mid. & Lower } | ||
| .... | 180± 5 | .... |
| TRIASSIC | 45 | |
| .... | 225 ± 5 | .... |
| PERMIAN | 45 | |
| .... | 270 ± 5 | .... |
| Upper } | ||
| CARBONIFEROUS | 80 | |
| Lower } | ||
| .... | 350 ± 10 | .... |
| Upper } | ||
| DEVONIAN | 50 | |
| Lower } | ||
| .... | 400 ± 10 | .... |
| SILURIAN | 40 | |
| .... | 440 ± 10 | .... |
| ORDOVICIAN | 60 | |
| .... | 500 ± 15 | .... |
| CAMBRIAN | 100 | |
| .... | 600 ± 20 | .... |
Using measurements made in many laboratories, and interpolating between them by using the relative thicknesses of sediments, the great British geologist, Arthur Holmes, established the time scale that is in general use today. His original scale is shown on the preceding page. Small changes can be expected to be made in this scale from time to time, but major alterations are not likely, except perhaps in the Cambrian Epoch where the present data are unreliable because they are not complete. (A scale showing the epochs or periods as often given now is on page 4.)
Precambrian Stratigraphy
So far we have talked only about rocks that are of the Cambrian Epoch or younger—rocks that may contain fossils. Yet there are vast areas (most of Canada, for example) that are covered with rocks older than the Cambrian formation. Some Precambrian fossils have been found, but they are so rare that they are useless for dating the strata containing them. Long-range correlation of Precambrian rocks must rely on nuclear measurements. Therefore it has been only in the last dozen or so years that some order could be established for the Precambrian rock sequences. The elaborate Precambrian stratigraphies (arrangements of strata in sequence) proposed in the past, most of them based on superficial similarities of the rocks in one place to those in another place, now have been drastically altered and in some cases completely overturned by nuclear measurements. We are still far from understanding the sequence of all the events in that vast span of time we call the Precambrian. Many thousands of nuclear age determinations will have to be made to lighten the dark corners of our ignorance.
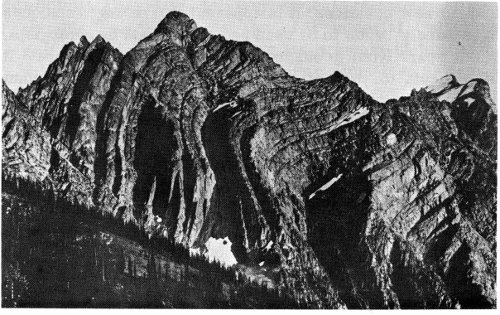
Folded strata of Precambrian rocks, including limestones and shales, in Glacier National Park, Montana.
AND WHERE DO WE GO FROM HERE?
Perhaps we must first realize that we really haven’t come very far yet. Granted that the age of rocks in many parts of the world is now suddenly known—and that this was a total mystery some dozen years ago. Granted that enormous strides forward have been made. It’s only a beginning.
Vast areas of the world are still geologically unexplored. The geologic time scale is still fragmentary and crude. Thousands of important geologic questions remain to be defined, explored, and answered by nuclear age determination. And—as is inevitable in science—many of them will lead to new questions. It is apparent that dating techniques have barely begun to be used and understood by geologists.
But apart from geologic work, what else is in store? It is difficult to predict, but probably the most important advance in the next decade or two will come when we obtain samples of rock from the moon. Will there be young rocks there or will they all be 4550 million years old? Or will they perhaps be some other age? The chemical composition and nuclear ages of the first moon samples will probably be the most important information we can hope to obtain from them. These results from the moon will contribute enormously to our understanding of the processes that formed the earth, made the continents, and determined the major features of our world.
We have a long way to go.
GLOSSARY
AEON One billion (10⁹) years.
ALPHA DECAY Radioactive decay with emission of an alpha particle.
ALPHA PARTICLE Essentially the nucleus of helium, composed of two neutrons and two protons with double positive charge.
ANTICOINCIDENCE RING A ring of counters connected to exclude outside radiation.
BACKGROUND COUNT The number of impulses per unit time registered on a counting instrument when no sample is present.
BETA DECAY Radioactive decay with emission of a beta particle.
BETA PARTICLE An electron emitted by a nucleus.
BRACKETED INTRUSIVE Igneous rock extending into sedimentary rocks that are datable by their fossils.
CLOSED SYSTEM A system in which the parent material radioactively decays into its daughter products and nothing is added or removed.
COMMON (strontium, lead, etc.) The ordinary element present in nature at any one time as distinguished from that produced by radioactive decay.
CONCORDIA ANALYSIS A mathematical technique to determine graphically the age of a material containing radiogenic lead by comparing its uranium-to-lead ratio with the similar ratio in a closed uranium-lead system.
CONTACT METAMORPHISM A metamorphism genetically related to the intrusion of molten masses of rock and taking place at or near the contact.
COSMIC RAYS High-energy particles moving in our galaxy.
CRYSTAL A periodic or regularly repeating arrangement of atoms, formed from a single element or compound.
DAUGHTER A nuclide formed from the radioactive decay of another nuclide.
DECAY CONSTANT The number of atoms decaying per atom per unit of time (0.693/half-life).
ELECTRON CAPTURE A nuclear process in which the nucleus of an atom captures an electron from one of the inner shells.
ELECTRONS Elementary particles with a unit negative electrical charge and a mass 1/1837 that of the proton, or 9.12 × 10⁻²⁷ gram. Electrons surround the atom’s positively charged nucleus and determine the atom’s chemical properties.
GAMMA RAYS Electromagnetic radiation from an atomic nucleus.
GEIGER COUNTERS Instruments that count pulses produced by radioactivity, consisting of a counting tube with a central wire anode, usually filled with a mixture of argon and organic vapor.
HALF-LIFE The time it takes for half the atoms in a radioactive substance to decay.
ION An atom or molecule that has lost or gained one or more electrons and is thus electrically charged.
ISOTOPE DILUTION An analytical technique involving addition of a known amount of an isotopic mixture of abnormal composition to the unknown amount of an element of normal or known isotopic composition.
ISOTOPES Nuclides of the same atomic number but different atomic weight. Isotopes of a given element have an identical number of protons but different numbers of neutrons in their nuclei.
LAW OF SUPERPOSITION Statement that overlying strata must be younger than underlying strata if there has been no inversion.
MASS SPECTROMETER An instrument for separation and measurement of isotopes by their mass.
NET COUNTING RATE Sample counting rate minus background counting rate.
NEUTRONS Elementary particles in the nucleus having no electric charge and the mass of one atomic mass unit.
NUCLIDE A species of atom characterized by the constitution of its nucleus.
ORIGINAL (strontium, lead, etc.) Common strontium, lead, etc., taken into a system at the time of its formation.
PALEONTOLOGY The study of fossil remains.
PARENT The radioactive element from which a daughter nuclide is produced by radioactive decay.
PLUMBOLOGY The study of the uranium and thorium-lead decay systems. The name is derived from the Latin name for lead, plumbum.
PRIMORDIAL Present at the time of the formation of the earth.
PROPORTIONAL COUNTER An instrument for detecting radiation by producing pulses of electrical charge that are proportional to the energy of the radiation being measured. The design permits use of radiation of a desired energy level (within limits), and discrimination against other radiation, especially background radiation.
PROTONS Elementary particles with a single positive electrical charge and a mass approximately 1837 times that of the electron. The atomic number of an atom is equal to the number of protons in its nucleus.
RADIOACTIVE DECAY The change of one nuclide to another by the emission of charged particles from the nucleus of its atom.
RADIOACTIVITY The property of some nuclides to decay by themselves into others.
RADIOGENIC Formed as the result of radioactive decay.
RARE EARTH Any of the elements from atomic number 57 (lanthanum) to 71 (lutetium).
SAMPLE COUNTER An instrument into which a sample of material can be placed to have its radiation measured.
SECULAR EQUILIBRIUM The production of a radioactive substance at a rate equal to its decay.
SPECIFIC ACTIVITY The number of atoms decaying per unit time per unit weight of the total amount being tested.
SPIKE A known amount of an element of unusual isotopic composition used in isotope-dilution analysis.
STATISTICAL ERROR The error associated with nuclear measurements and arising from the random distribution of nuclear events.
STRATA Plural of stratum. A sheet or mass of sedimentary rock (formed by deposits of sediments, as from ancient seas) of one kind, usually in layers between beds or layers of other kinds.
APPENDIX
Radioactive Decay
When a radioactive nucleus disintegrates or decays, the resultant remaining nucleus may still be radioactive, and sooner or later it also will disintegrate and become still another kind of atom. This process continues through a series of distinct steps until a stable atom—one that is not radioactive—is formed. All natural radioactivity in the heavy elements proceeds by such a series of steps, and the series finally ends with a stable form of lead as its end product. In other words, any naturally radioactive heavy element eventually becomes nonradioactive lead.
The nucleus of every atom (except hydrogen) contains one or more neutrons and one or more protons. The instability of the nuclei of the heavy atoms is related to the ratio of the number of neutrons to the number of protons in the nuclei. Radioactive decay is, in fact, a way of adjusting these ratios. The adjustment can occur in various ways. The most common is the emission of alpha particles or beta particles.
An alpha particle is identical with the nucleus of a helium atom and has two neutrons and two protons bundled together. Loss of an alpha particle from a nucleus lowers the mass number (the total of protons and neutrons) of the parent nucleus by four and the atomic number (the number of protons) by two; the number of neutrons also is reduced by two.
A beta particle is an electron and has a negative electric charge. When a beta particle is emitted from a nucleus, the nucleus is changed so that it has one more proton (which has a positive charge) and one less neutron (which has no charge); in effect, a neutron has changed into a proton as the nucleus lost a negative charge. Beta decay occurs in nuclei with a greater proportion of neutrons than is normal for the number of protons. Since beta emission increases the proportion of protons, the process raises the atomic number of the parent nucleus by one and leaves the mass number the same.
Gamma rays are a form of electromagnetic radiation. They are emitted when a nucleus shifts from one energy state to a lower energy state—the energy difference emerging as the gamma radiation. Gamma emission often accompanies alpha or beta emission, but the production of gamma rays does not itself alter the atomic number nor the mass number of the parent.
Nuclei also can decay by emission of a positron, which is a positively charged electron. When this occurs, the new nucleus has one more neutron and one less proton than its parent; in effect a proton has become a neutron as the nucleus loses a positive charge. Positrons usually are emitted by nuclei that have a greater proportion of protons than is normal for the number of neutrons.
Another process—internal electron conversion—sometimes occurs in connection with gamma-ray emission, usually in heavy elements when the gamma-ray energy is low. Instead of being emitted directly, the gamma ray strikes an orbital electron, knocking the electron out of the atom; the gamma ray then disappears. Another electron jumps into the “hole” in the orbit from which the first electron was emitted, and this jump—from a higher to a lower energy level—results in the emission of an X ray (which is similar to a gamma ray, but originates in the electron orbit region of the atom, not in the nucleus).
Finally, a nucleus may be altered by electron capture. In a nucleus with a low ratio of neutrons to protons, the nucleus captures one of its own orbital electrons. This immediately combines with a proton to form a new neutron and emit a neutrino (a high-energy particle with neither mass nor charge). The process increases the neutron-to-proton ratio of the nucleus; the daughter has the same mass number as the parent, but has an atomic number one less than the parent.
There are three series by which naturally radioactive nuclei decay to stable ones: The Uranium Series, the Thorium Series, and the Actinium Series. Man-made radioactive nuclei decay similarly, with bismuth as the end product, via the Neptunium Series. These can be illustrated in tabular form and diagrammatically. The Actinium Series (Uranium-235 Series), for example, proceeds like this:
| THE URANIUM-235 SERIES | ||||
|---|---|---|---|---|
| Element | Symbol | Radiation Emitted | Half-life | |
| Uranium | ²³⁵U | α | 7.13 × 10⁸ years | |
| Thorium | ²³¹Th | β | 25.6 hours | |
| Protactinium | ²³¹Pa | α | 3.25 × 10⁴ years | |
| Actinium[16] | ²²⁷Ac | β (98.8%) and α (1.2%) | 21.2 years | |
| Thorium | ²²⁷Th | α | 18.17 days | |
| Francium | ²²³Fr | β | 22 minutes | |
| Radium | ²²³Ra | α | 11.7 days | |
| Radon | ²¹⁹Rn | α | 4.0 seconds | |
| Polonium[16] | ²¹⁵Po | α (~100%) and β (~5 × 10⁻⁴%) | 1.83 × 10⁻³ second | |
| Lead | ²¹¹Pb | β | 36.1 minutes | |
| Astatine | ²¹⁵At | α | ~10⁻⁴ second | |
| Bismuth[16] | ²¹¹Bi | α (99.7%) and β (0.3%) | 2.15 minutes | |
| Polonium | ²¹¹Po | α | 0.25 second | |
| Thallium | ²⁰⁷Tl | β | 4.78 minutes | |
| Lead | ²⁰⁷Pb | — | Stable | |
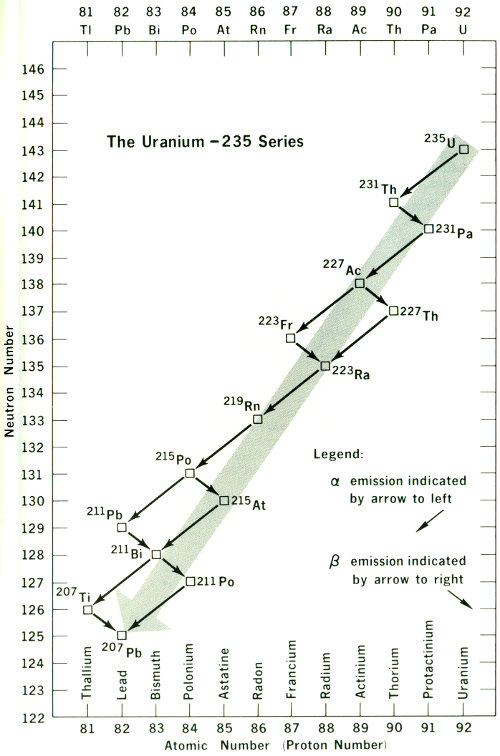
The Uranium-235 Series
The Uranium (Uranium-238) Series proceeds like this:
| THE URANIUM-238 SERIES | |||
|---|---|---|---|
| Element | Symbol | Radiation | Half-life |
| Uranium | ²³⁸U | α | 4.51 × 10⁹ years |
| Thorium | ²³⁴Th | β | 24.1 days |
| Protactinium[17] | ²³⁴Pa | β | 1.18 minutes |
| Uranium | ²³⁴U | α | 2.48 × 10⁵ years |
| Thorium | ²³⁰Th | α | 7.6 × 10⁴ years |
| Radium | ²²⁶Ra | α | 1.62 × 10³ years |
| Radon | ²²²Rn | α | 3.82 days |
| Polonium[18] | ²¹⁸Po | α (99.98%) and β (0.02%) | 3.05 minutes |
| Lead | ²¹⁴Pb | β | 26.8 minutes |
| Astatine | ²¹⁸At | α | 1.3 seconds |
| Bismuth[18] | ²¹⁴Bi | β (99.96%) and α (0.04%) | 19.7 minutes |
| Polonium | ²¹⁴Po | α | 1.6 × 10⁻⁴ second |
| Thallium | ²¹⁰Tl | β | 1.32 minutes |
| Lead | ²¹⁰Pb | β | 22 years |
| Bismuth[18] | ²¹⁰Bi | β (~100%) and α (~2 × 10⁻⁴%) | 5.0 days |
| Polonium | ²¹⁰Po | α | 138.4 days |
| Thallium | ²⁰⁶Tl | β | 4.30 minutes |
| Lead | ²⁰⁶Pb | ... | Stable |
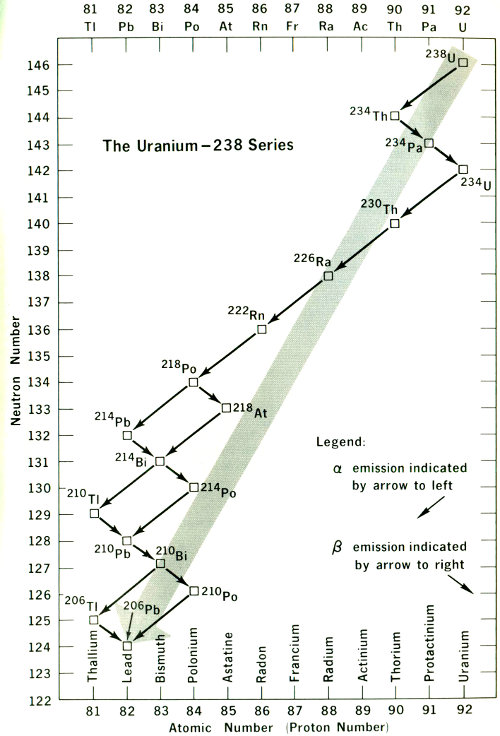
The Uranium-238 Series
SUGGESTED REFERENCES
Books
How Old Is the Earth?, Patrick M. Hurley, Doubleday & Company, Inc., Garden City, New York, 1959, 160 pp., $1.25.
Radiocarbon Dating (second edition), Willard F. Libby, University of Chicago Press, Chicago, Illinois, 1955, 175 pp., $5.00 (hardback); $1.95 (paperback).
The Birth and Death of the Sun, George Gamow, The Viking Press, New York, 1949, 238 pp., $4.75 (out of print but available through libraries), $0.60 (paperback) from the New American Library of World Literature, Inc., New York.
Inside the Nucleus, Irving Adler, The John Day Company, Inc., New York, 1963, 191 pp., $4.95 (hardback); $0.60 (paperback) from the New American Library of World Literature, Inc., New York.
Ages of Rocks, Planets, and Stars, Henry Faul, McGraw-Hill Book Company, New York, 1966, 109 pp., $2.45.
Principles of Geochemistry (second edition), Brian Mason, John Wiley & Sons, Inc., New York, 1958, 310 pp., $7.50. (New edition due in 1967.)
Potassium Argon Dating, J. H. Zahringer and O. A. Schaeffer, Springer-Verlag New York, Inc., New York, 1966, 250 pp., $12.50.
Articles
A Clock for the Ages: Potassium Argon, Garniss H. Curtis, National Geographic Magazine, 120: 590 (October 1961).
Exploring 1,750,000 Years into Man’s Past, L. S. B. Leakey, National Geographic Magazine, 120: 564 (October 1961).
Five-Billion-Year Clock, Patrick M. Hurley, Saturday Evening Post, 234: 26 (March 18, 1961).
Geologic Time Scale, J. Laurence Kulp, Science, 133: 1105 (April 14, 1961).
Geology, Reginald A. Daly, Scientific American, 183: 36 (September 1950).
Tracks of Charged Particles in Solids, R. L. Fleischer, P. B. Price, and R. M. Walker, Science, 149: 383 (July 23, 1965).
How Old Is It?, Lyman J. Briggs and Kenneth F. Weaver, National Geographic Magazine, 114: 234 (August 1958).
Moving Picture of the Last Ice Age, Richard Foster Flint, Natural History, 66: 188 (April 1957).
Modern Methods for Measurement of Geologic Time, E. J. Zeller, Mineral Information Service, 18: 9 (January 1965). Single copies are $0.10 from Division of Mines and Geology, Ferry-Building, San Francisco, California 94111.
Fluted Projectile Points: Their Age and Dispersion, C. Vance Haynes, Jr., Science, 145: 1408 (September 25, 1964).
Unraveling the Age of Earth and Man, E. L. Simons, Natural History, 76: 52 (February 1967).
Radiocarbon Dating and Archeology in North America, F. Johnson, Science, 155: 165 (January 13, 1967).
Fission-track Dating of Bed I, Olduvai Gorge, R. L. Fleischer and others, Science, 146: 72 (April 2, 1965).
Lead Isotopes and the Age of the Earth, G. R. Tilton and R. H. Steiger, Science, 150: 1805 (December 31, 1965).
Strontium-Rubidium Age of an Iron Meteorite, G. J. Wasserburg and others, Science, 150: 1814 (December 31, 1965).
THE COVER
U. S. Geological Survey scientists prepare acetylene gas, made from the carbon-14 in a geological specimen, in a vacuum line. This gas will be fed into a proportional counter to determine the age of the specimen by its ¹⁴C count. (See “Carbon-14 Counting” beginning on page 12.)
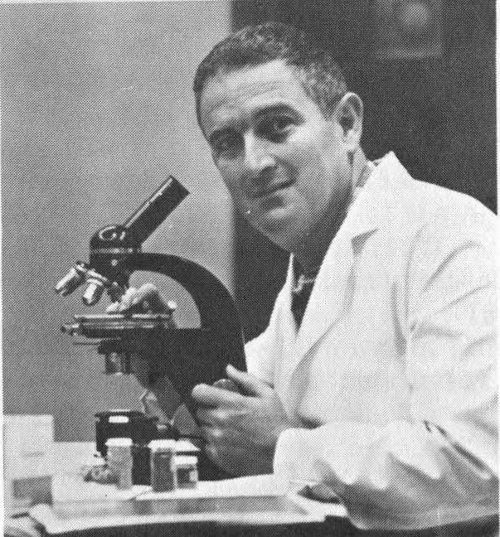
THE AUTHOR
Geophysicist Henry Faul, an authority on nuclear dating, is professor of Geophysics and chairman of the Department of Geology at the University of Pennsylvania, Philadelphia. He holds a doctoral degree from the Massachusetts Institute of Technology, and has taught at the Universities of Strasbourg and Bern in Europe. Dr. Faul was a geophysicist with the Manhattan Project during World War II, and was formerly chief of the Radiation Laboratory, U. S. Geological Survey, Denver, Colorado. For many years he was engaged in geological age determination work with the Geological Survey and the Carnegie Institution of Washington in Washington, D. C.
PHOTO CREDITS
Frontispiece courtesy Anthropology Department, Southern Methodist University (SMU)
Cover photo courtesy U. S. Geological Survey (USGS)
| Page | |
|---|---|
| 11 | USGS |
| 12 | USGS |
| 14, 16, 17 | Willard F. Libby |
| 18 | University of Arizona |
| 21 | Massachusetts Institute of Technology |
| 22 | Graduate Research Center of the Southwest |
| 23 | Graduate Research Center of the Southwest |
| 25 | Robert L. Fleischer |
| 26 | Perkin-Elmer Corporation |
| 30 | University of Texas |
| 32 | Graduate Research Center of the Southwest |
| 36 | Massachusetts Institute of Technology |
| 40 | Des Bartlett, Armand Denis Productions |
| 43 | Anthropology Department, SMU |
| 44 | USGS |
| 47 | USGS |
| 59 | Author’s photo courtesy Graduate Research Center of the Southwest |
Footnotes
This booklet is one of the “Understanding the Atom” Series. Comments are invited on this booklet and others in the series; please send them to the Division of Technical Information, U. S. Atomic Energy Commission, Washington, D. C. 20545.
Published as part of the AEC’s educational assistance program, the series includes these titles:
- Accelerators
- Animals in Atomic Research
- Atomic Fuel
- Atomic Power Safety
- Atoms at the Science Fair
- Atoms in Agriculture
- Atoms, Nature, and Man
- Careers in Atomic Energy
- Computers
- Controlled Nuclear Fusion
- Cryogenics, The Uncommon Cold
- Direct Conversion of Energy
- Fallout From Nuclear Tests
- Food Preservation by Irradiation
- Genetic Effects of Radiation
- Index to the UAS Series
- Lasers
- Microstructure of Matter
- Neutron Activation Analysis
- Nondestructive Testing
- Nuclear Clocks
- Nuclear Energy for Desalting
- Nuclear Power and Merchant Shipping
- Nuclear Power Plants
- Nuclear Propulsion for Space
- Nuclear Reactors
- Nuclear Terms, A Brief Glossary
- Our Atomic World
- Plowshare
- Plutonium
- Power from Radioisotopes
- Power Reactors in Small Packages
- Radioactive Wastes
- Radioisotopes and Life Processes
- Radioisotopes in Industry
- Radioisotopes in Medicine
- Rare Earths
- Reading Resources in Atomic Energy
- Research Reactors
- SNAP, Nuclear Space Reactors
- Sources of Nuclear Fuel
- Space Radiation
- Synthetic Transuranium Elements
- The Atom and the Ocean
- The Chemistry of the Noble Gases
- The First Reactor
- Whole Body Counters
- Your Body and Radiation
A single copy of any one booklet, or of no more than three different booklets, may be obtained free by writing to:
USAEC, P.O. BOX 62, OAK RIDGE, TENNESSEE 37830
Complete sets of the series are available to school and public librarians, and to teachers who can make them available for reference or for use by groups. Requests should be made on school or library letterheads and indicate the proposed use.
Students and teachers who need other material on specific aspects of nuclear science, or references to other reading material, may also write to the Oak Ridge address. Requests should state the topic of interest exactly, and the use intended.
In all requests, include “Zip Code” in return address.
Printed in the United States of America
USAEC Division of Technical Infection Extension, Oak Ridge, Tennessee
