
.
Indonesia

Java, Across the Equator, Thomas H. Reid
Java, Facts and Fancies by Augusta de Wit
Monumental Java, by J. F. Scheltema
Indonesia (East & Southeast Asia)
Introduction :: Indonesia
Background: This entry usually highlights major historic events and current issues and may include a statement about one or two key future trends. Background field listing
The Dutch began to colonize Indonesia in the early 17th century; Japan occupied the islands from 1942 to 1945. Indonesia declared its independence shortly before Japan's surrender, but it required four years of sometimes brutal fighting, intermittent negotiations, and UN mediation before the Netherlands agreed to transfer sovereignty in 1949. A period of sometimes unruly parliamentary democracy ended in 1957 when President SOEKARNO declared martial law and instituted "Guided Democracy." After an abortive coup in 1965 by alleged communist sympathizers, SOEKARNO was gradually eased from power. From 1967 until 1998, President SUHARTO ruled Indonesia with his "New Order" government. After street protests toppled SUHARTO in 1998, free and fair legislative elections took place in 1999. Indonesia is now the world's third most populous democracy, the world's largest archipelagic state, and the world's largest Muslim-majority nation. Current issues include: alleviating poverty, improving education, preventing terrorism, consolidating democracy after four decades of authoritarianism, implementing economic and financial reforms, stemming corruption, reforming the criminal justice system, addressing climate change, and controlling infectious diseases, particularly those of global and regional importance. In 2005, Indonesia reached a historic peace agreement with armed separatists in Aceh, which led to democratic elections in Aceh in December 2006. Indonesia continues to face low intensity armed resistance in Papua by the separatist Free Papua Movement.
Geography :: Indonesia
Location: This entry identifies the country's regional location, neighboring countries, and adjacent bodies of water. Location field listing
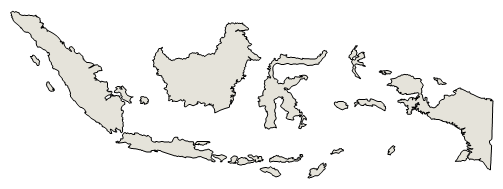
Southeastern Asia, archipelago between the Indian Ocean and the Pacific Ocean
Geographic coordinates: This entry includes rounded latitude and longitude figures for the centroid or center point of a country expressed in degrees and minutes; it is based on the locations provided in the Geographic Names Server (GNS), maintained by the National Geospatial-Intelligence Agency on behalf of the US Board on Geographic Names. Geographic coordinates field listing
5 00 S, 120 00 E
Map references: This entry includes the name of the Factbook reference map on which a country may be found. Note that boundary representations on these maps are not necessarily authoritative. The entry on Geographic coordinates may be helpful in finding some smaller countries. Map references field listing
Southeast Asia
Area: This entry includes three subfields. Total area is the sum of all land and water areas delimited by international boundaries and/or coastlines. Land area is the aggregate of all surfaces delimited by international boundaries and/or coastlines, excluding inland water bodies (lakes, reservoirs, rivers). Water area is the sum of the surfaces of all inland water bodies, such as lakes, reservoirs, or rivers, as delimited by international boundaries and/or coastlines. Area field listing
total: 1,904,569 sq km
land: 1,811,569 sq km
water: 93,000 sq km
country comparison to the world: 16
Area - comparative: This entry provides an area comparison based on total area equivalents. Most entities are compared with the entire US or one of the 50 states based on area measurements (1990 revised) provided by the US Bureau of the Census. The smaller entities are compared with Washington, DC (178 sq km, 69 sq mi) or The Mall in Washington, DC (0.59 sq km, 0.23 sq mi, 146 acres). Area - comparative field listing
slightly less than three times the size of Texas
Area comparison map: Area comparison map
Land boundaries: This entry contains the total length of all land boundaries and the individual lengths for each of the contiguous border countries. When available, official lengths published by national statistical agencies are used. Because surveying methods may differ, country border lengths reported by contiguous countries may differ. Land boundaries field listing
total: 2,958 km
border countries (3): Malaysia 1881 km, Papua New Guinea 824 km, Timor-Leste 253 km
Coastline: This entry gives the total length of the boundary between the land area (including islands) and the sea. Coastline field listing
54,716 km
Maritime claims: This entry includes the following claims, the definitions of which are excerpted from the United Nations Convention on the Law of the Sea (UNCLOS), which alone contains the full and definitive descriptions: territorial sea - the sovereignty of a coastal state extends beyond its land territory and internal waters to an adjacent belt of sea, described as the territorial sea in the UNCLOS (Part II); this sovereignty extends to the air space over the territorial sea as well as its underlying s . . . more Maritime claims field listing
territorial sea: 12 nm
exclusive economic zone: 200 nm
measured from claimed archipelagic straight baselines
Climate: This entry includes a brief description of typical weather regimes throughout the year; in the Word entry only, it includes four subfields that describe climate extremes:ten driest places on earth (average annual precipitation) describes the annual average precipitation measured in both millimeters and inches for selected countries with climate extremes. ten wettest places on earth (average annual precipitation) describes the annual average precipitation measured in both millimeters and i . . . more Climate field listing
tropical; hot, humid; more moderate in highlands
Terrain: This entry contains a brief description of the topography. Terrain field listing
mostly coastal lowlands; larger islands have interior mountains
Elevation: This entry includes the mean elevation and elevation extremes, lowest point and highest point. Elevation field listing
mean elevation: 367 m
lowest point: Indian Ocean 0 m
highest point: Puncak Jaya 4,884 m
Natural resources: This entry lists a country's mineral, petroleum, hydropower, and other resources of commercial importance, such as rare earth elements (REEs). In general, products appear only if they make a significant contribution to the economy, or are likely to do so in the future. Natural resources field listing
petroleum, tin, natural gas, nickel, timber, bauxite, copper, fertile soils, coal, gold, silver
Land use: This entry contains the percentage shares of total land area for three different types of land use: agricultural land, forest, and other; agricultural land is further divided into arable land - land cultivated for crops like wheat, maize, and rice that are replanted after each harvest, permanent crops - land cultivated for crops like citrus, coffee, and rubber that are not replanted after each harvest, and includes land under flowering shrubs, fruit trees, nut trees, and vines, and permane . . . more Land use field listing
agricultural land: 31.2% (2011 est.)
arable land: 13% (2011 est.) / permanent crops: 12.1% (2011 est.) / permanent pasture: 6.1% (2011 est.)
forest: 51.7% (2011 est.)
other: 17.1% (2011 est.)
Irrigated land: This entry gives the number of square kilometers of land area that is artificially supplied with water. Irrigated land field listing
67,220 sq km (2012)
Population distribution: This entry provides a summary description of the population dispersion within a country. While it may suggest population density, it does not provide density figures. Population distribution field listing
major concentration on the island of Java, which is considered one of the most densely populated places on earth; of the outer islands (those surrounding Java and Bali), Sumatra contains some of the most significant clusters, particularly in the south near the Selat Sunda, and along the northeastern coast near Medan; the cities of Makasar (Sulawesi), Banjarmasin (Kalimantan) are also heavily populated
Natural hazards: This entry lists potential natural disasters. For countries where volcanic activity is common, a volcanism subfield highlights historically active volcanoes. Natural hazards field listing
occasional floods; severe droughts; tsunamis; earthquakes; volcanoes; forest fires
volcanism: Indonesia contains the most volcanoes of any country in the world - some 76 are historically active; significant volcanic activity occurs on Java, Sumatra, the Sunda Islands, Halmahera Island, Sulawesi Island, Sangihe Island, and in the Banda Sea; Merapi (2,968 m), Indonesia's most active volcano and in eruption since 2010, has been deemed a Decade Volcano by the International Association of Volcanology and Chemistry of the Earth's Interior, worthy of study due to its explosive history and close proximity to human populations; other notable historically active volcanoes include Agung, Awu, Karangetang, Krakatau (Krakatoa), Makian, Raung, and Tambora; see note 2 under "Geography - note"
Environment - current issues: This entry lists the most pressing and important environmental problems. The following terms and abbreviations are used throughout the entry: Acidification - the lowering of soil and water pH due to acid precipitation and deposition usually through precipitation; this process disrupts ecosystem nutrient flows and may kill freshwater fish and plants dependent on more neutral or alkaline conditions (see acid rain). Acid rain - characterized as containing harmful levels of sulfur dioxi . . . more Environment - current issues field listing
large-scale deforestation (much of it illegal) and related wildfires cause heavy smog; over-exploitation of marine resources; environmental problems associated with rapid urbanization and economic development, including air pollution, traffic congestion, garbage management, and reliable water and waste water services; water pollution from industrial wastes, sewage
Environment - international agreements: This entry separates country participation in international environmental agreements into two levels - party to and signed, but not ratified. Agreements are listed in alphabetical order by the abbreviated form of the full name. Environment - international agreements field listing
party to: Biodiversity, Climate Change, Climate Change-Kyoto Protocol, Desertification, Endangered Species, Hazardous Wastes, Law of the Sea, Ozone Layer Protection, Ship Pollution, Tropical Timber 83, Tropical Timber 94, Wetlands
signed, but not ratified: Marine Life Conservation
Geography - note: This entry includes miscellaneous geographic information of significance not included elsewhere. Geography - note field listing
note 1: according to Indonesia's National Coordinating Agency for Survey and Mapping, the total number of islands in the archipelago is 13,466, of which 922 are permanently inhabited (Indonesia is the world's largest country comprised solely of islands); the country straddles the equator and occupies a strategic location astride or along major sea lanes from the Indian Ocean to the Pacific Ocean
note 2: Indonesia is one of the countries along the Ring of Fire, a belt of active volcanoes and earthquake epicenters bordering the Pacific Ocean; up to 90% of the world's earthquakes and some 75% of the world's volcanoes occur within the Ring of Fire
note 3: despite having the fourth largest population in the world, Indonesia is the most heavily forested region on earth after the Amazon
People and Society :: Indonesia
Population: This entry gives an estimate from the US Bureau of the Census based on statistics from population censuses, vital statistics registration systems, or sample surveys pertaining to the recent past and on assumptions about future trends. The total population presents one overall measure of the potential impact of the country on the world and within its region. Note: Starting with the 1993 Factbook, demographic estimates for some countries (mostly African) have explicitly taken into account t . . . more Population field listing
267,026,366 (July 2020 est.)
country comparison to the world: 4
Nationality: This entry provides the identifying terms for citizens - noun and adjective. Nationality field listing
noun: Indonesian(s)
adjective: Indonesian
Ethnic groups: This entry provides an ordered listing of ethnic groups starting with the largest and normally includes the percent of total population. Ethnic groups field listing
Javanese 40.1%, Sundanese 15.5%, Malay 3.7%, Batak 3.6%, Madurese 3%, Betawi 2.9%, Minangkabau 2.7%, Buginese 2.7%, Bantenese 2%, Banjarese 1.7%, Balinese 1.7%, Acehnese 1.4%, Dayak 1.4%, Sasak 1.3%, Chinese 1.2%, other 15% (2010 est.)
Languages: This entry provides a listing of languages spoken in each country and specifies any that are official national or regional languages. When data is available, the languages spoken in each country are broken down according to the percent of the total population speaking each language as a first language. For those countries without available data, languages are listed in rank order based on prevalence, starting with the most-spoken language. Languages field listing
Bahasa Indonesia (official, modified form of Malay), English, Dutch, local dialects (of which the most widely spoken is Javanese)
note: more than 700 languages are used in Indonesia
Religions: This entry is an ordered listing of religions by adherents starting with the largest group and sometimes includes the percent of total population. The core characteristics and beliefs of the world's major religions are described below. Baha'i - Founded by Mirza Husayn-Ali (known as Baha'u'llah) in Iran in 1852, Baha'i faith emphasizes monotheism and believes in one eternal transcendent God. Its guiding focus is to encourage the unity of all peoples on the earth so that justice and peace m . . . more Religions field listing
Muslim 87.2%, Protestant 7%, Roman Catholic 2.9%, Hindu 1.7%, other 0.9% (includes Buddhist and Confucian), unspecified 0.4% (2010 est.)
Age structure: This entry provides the distribution of the population according to age. Information is included by sex and age group as follows: 0-14 years (children), 15-24 years (early working age), 25-54 years (prime working age), 55-64 years (mature working age), 65 years and over (elderly). The age structure of a population affects a nation's key socioeconomic issues. Countries with young populations (high percentage under age 15) need to invest more in schools, while countries with older population . . . more Age structure field listing
0-14 years: 23.87% (male 32,473,246/female 31,264,034)
15-24 years: 16.76% (male 22,786,920/female 21,960,130)
25-54 years: 42.56% (male 58,249,570/female 55,409,579)
55-64 years: 8.99% (male 11,033,838/female 12,968,005)
65 years and over: 7.82% (male 9,099,773/female 11,781,271) (2020 est.)
population pyramid: population pyramid
Dependency ratios: Dependency ratios are a measure of the age structure of a population. They relate the number of individuals that are likely to be economically "dependent" on the support of others. Dependency ratios contrast the ratio of youths (ages 0-14) and the elderly (ages 65+) to the number of those in the working-age group (ages 15-64). Changes in the dependency ratio provide an indication of potential social support requirements resulting from changes in population age structures. As fertility leve . . . more Dependency ratios field listing
total dependency ratio: 47.5
youth dependency ratio: 38.3
elderly dependency ratio: 9.2
potential support ratio: 10.8 (2020 est.)
Median age: This entry is the age that divides a population into two numerically equal groups; that is, half the people are younger than this age and half are older. It is a single index that summarizes the age distribution of a population. Currently, the median age ranges from a low of about 15 in Niger and Uganda to 40 or more in several European countries and Japan. See the entry for "Age structure" for the importance of a young versus an older age structure and, by implication, a low versus a high . . . more Median age field listing
total: 31.1 years
male: 30.5 years
female: 31.8 years (2020 est.)
country comparison to the world: 117
Population growth rate: The average annual percent change in the population, resulting from a surplus (or deficit) of births over deaths and the balance of migrants entering and leaving a country. The rate may be positive or negative. The growth rate is a factor in determining how great a burden would be imposed on a country by the changing needs of its people for infrastructure (e.g., schools, hospitals, housing, roads), resources (e.g., food, water, electricity), and jobs. Rapid population growth can be seen as . . . more Population growth rate field listing
0.79% (2020 est.)
country comparison to the world: 129
Birth rate: This entry gives the average annual number of births during a year per 1,000 persons in the population at midyear; also known as crude birth rate. The birth rate is usually the dominant factor in determining the rate of population growth. It depends on both the level of fertility and the age structure of the population. Birth rate field listing
15.4 births/1,000 population (2020 est.)
country comparison to the world: 116
Death rate: This entry gives the average annual number of deaths during a year per 1,000 population at midyear; also known as crude death rate. The death rate, while only a rough indicator of the mortality situation in a country, accurately indicates the current mortality impact on population growth. This indicator is significantly affected by age distribution, and most countries will eventually show a rise in the overall death rate, in spite of continued decline in mortality at all ages, as declining . . . more Death rate field listing
6.6 deaths/1,000 population (2020 est.)
country comparison to the world: 140
Net migration rate: This entry includes the figure for the difference between the number of persons entering and leaving a country during the year per 1,000 persons (based on midyear population). An excess of persons entering the country is referred to as net immigration (e.g., 3.56 migrants/1,000 population); an excess of persons leaving the country as net emigration (e.g., -9.26 migrants/1,000 population). The net migration rate indicates the contribution of migration to the overall level of population chan . . . more Net migration rate field listing
-1.1 migrant(s)/1,000 population (2020 est.)
country comparison to the world: 145
Population distribution: This entry provides a summary description of the population dispersion within a country. While it may suggest population density, it does not provide density figures. Population distribution field listing
major concentration on the island of Java, which is considered one of the most densely populated places on earth; of the outer islands (those surrounding Java and Bali), Sumatra contains some of the most significant clusters, particularly in the south near the Selat Sunda, and along the northeastern coast near Medan; the cities of Makasar (Sulawesi), Banjarmasin (Kalimantan) are also heavily populated
Urbanization: This entry provides two measures of the degree of urbanization of a population. The first, urban population, describes the percentage of the total population living in urban areas, as defined by the country. The second, rate of urbanization, describes the projected average rate of change of the size of the urban population over the given period of time. It is possible for a country with a 100% urban population to still display a change in the rate of urbanization (up or down). For example . . . more Urbanization field listing
urban population: 56.6% of total population (2020)
rate of urbanization: 2.27% annual rate of change (2015-20 est.)
Major urban areas - population: This entry provides the population of the capital and up to six major cities defined as urban agglomerations with populations of at least 750,000 people. An urban agglomeration is defined as comprising the city or town proper and also the suburban fringe or thickly settled territory lying outside of, but adjacent to, the boundaries of the city. For smaller countries, lacking urban centers of 750,000 or more, only the population of the capital is presented. Major urban areas - population field listing
10.770 million JAKARTA (capital), 3.394 million Bekasi, 2.944 million Surabaya, 2.580 million Bandung, 2.339 million Tangerang, 2.338 million Medan (2020)
Sex ratio: This entry includes the number of males for each female in five age groups - at birth, under 15 years, 15-64 years, 65 years and over, and for the total population. Sex ratio at birth has recently emerged as an indicator of certain kinds of sex discrimination in some countries. For instance, high sex ratios at birth in some Asian countries are now attributed to sex-selective abortion and infanticide due to a strong preference for sons. This will affect future marriage patterns and fertilit . . . more Sex ratio field listing
at birth: 1.05 male(s)/female
0-14 years: 1.04 male(s)/female
15-24 years: 1.04 male(s)/female
25-54 years: 1.05 male(s)/female
55-64 years: 0.85 male(s)/female
65 years and over: 0.77 male(s)/female
total population: 1 male(s)/female (2020 est.)
Mother's mean age at first birth: This entry provides the mean (average) age of mothers at the birth of their first child. It is a useful indicator for gauging the success of family planning programs aiming to reduce maternal mortality, increase contraceptive use – particularly among married and unmarried adolescents – delay age at first marriage, and improve the health of newborns. Mother's mean age at first birth field listing
22.8 years (2012 est.)
note: median age at first birth among women 25-29
Maternal mortality rate: The maternal mortality rate (MMR) is the annual number of female deaths per 100,000 live births from any cause related to or aggravated by pregnancy or its management (excluding accidental or incidental causes). The MMR includes deaths during pregnancy, childbirth, or within 42 days of termination of pregnancy, irrespective of the duration and site of the pregnancy, for a specified year. Maternal mortality rate field listing
177 deaths/100,000 live births (2017 est.)
country comparison to the world: 52
Infant mortality rate: This entry gives the number of deaths of infants under one year old in a given year per 1,000 live births in the same year. This rate is often used as an indicator of the level of health in a country. Infant mortality rate field listing
total: 20.4 deaths/1,000 live births
male: 24 deaths/1,000 live births
female: 16.7 deaths/1,000 live births (2020 est.)
country comparison to the world: 74
Life expectancy at birth: This entry contains the average number of years to be lived by a group of people born in the same year, if mortality at each age remains constant in the future. Life expectancy at birth is also a measure of overall quality of life in a country and summarizes the mortality at all ages. It can also be thought of as indicating the potential return on investment in human capital and is necessary for the calculation of various actuarial measures. Life expectancy at birth field listing
total population: 73.7 years
male: 71.1 years
female: 76.5 years (2020 est.)
country comparison to the world: 142
Total fertility rate: This entry gives a figure for the average number of children that would be born per woman if all women lived to the end of their childbearing years and bore children according to a given fertility rate at each age. The total fertility rate (TFR) is a more direct measure of the level of fertility than the crude birth rate, since it refers to births per woman. This indicator shows the potential for population change in the country. A rate of two children per woman is considered the replaceme . . . more Total fertility rate field listing
2.04 children born/woman (2020 est.)
country comparison to the world: 106
Contraceptive prevalence rate: This field gives the percent of women of reproductive age (15-49) who are married or in union and are using, or whose sexual partner is using, a method of contraception according to the date of the most recent available data. The contraceptive prevalence rate is an indicator of health services, development, and women’s empowerment. It is also useful in understanding, past, present, and future fertility trends, especially in developing countries. Contraceptive prevalence rate field listing
61% (2016/17)
Drinking water source: This entry provides information about access to improved or unimproved drinking water sources available to segments of the population of a country. Improved drinking water - use of any of the following sources: piped water into dwelling, yard, or plot; public tap or standpipe; tubewell or borehole; protected dug well; protected spring; or rainwater collection. Unimproved drinking water - use of any of the following sources: unprotected dug well; unprotected spring; cart with small tank or . . . more Drinking water source field listing
improved: urban: 94.2% of population
rural: 79.5% of population
total: 87.4% of population
unimproved: urban: 5.8% of population
rural: 20.5% of population
total: 12.6% of population (2015 est.)
Current Health Expenditure: Current Health Expenditure (CHE) describes the share of spending on health in each country relative to the size of its economy. It includes expenditures corresponding to the final consumption of health care goods and services and excludes investment, exports, and intermediate consumption. CHE shows the importance of the health sector in the economy and indicates the priority given to health in monetary terms. Note: Current Health Expenditure replaces the former Health Expenditures field . . . more Current Health Expenditure field listing
3% (2017)
Physicians density: This entry gives the number of medical doctors (physicians), including generalist and specialist medical practitioners, per 1,000 of the population. Medical doctors are defined as doctors that study, diagnose, treat, and prevent illness, disease, injury, and other physical and mental impairments in humans through the application of modern medicine. They also plan, supervise, and evaluate care and treatment plans by other health care providers. The World Health Organization estimates that f . . . more Physicians density field listing
0.38 physicians/1,000 population (2017)
Hospital bed density: This entry provides the number of hospital beds per 1,000 people; it serves as a general measure of inpatient service availability. Hospital beds include inpatient beds available in public, private, general, and specialized hospitals and rehabilitation centers. In most cases, beds for both acute and chronic care are included. Because the level of inpatient services required for individual countries depends on several factors - such as demographic issues and the burden of disease - there is . . . more Hospital bed density field listing
1.2 beds/1,000 population (2015)
Sanitation facility access: This entry provides information about access to improved or unimproved sanitation facilities available to segments of the population of a country. Improved sanitation - use of any of the following facilities: flush or pour-flush to a piped sewer system, septic tank or pit latrine; ventilated improved pit (VIP) latrine; pit latrine with slab; or a composting toilet. Unimproved sanitation - use of any of the following facilities: flush or pour-flush not piped to a sewer system, septic tank . . . more Sanitation facility access field listing
improved: urban: 72.3% of population (2015 est.)
rural: 47.5% of population (2015 est.)
total: 60.8% of population (2015 est.)
unimproved: urban: 27.7% of population (2015 est.)
rural: 52.5% of population (2015 est.)
total: 39.2% of population (2015 est.)
HIV/AIDS - adult prevalence rate: This entry gives an estimate of the percentage of adults (aged 15-49) living with HIV/AIDS. The adult prevalence rate is calculated by dividing the estimated number of adults living with HIV/AIDS at yearend by the total adult population at yearend. HIV/AIDS - adult prevalence rate field listing
0.4% (2018 est.)
country comparison to the world: 81
HIV/AIDS - people living with HIV/AIDS: This entry gives an estimate of all people (adults and children) alive at yearend with HIV infection, whether or not they have developed symptoms of AIDS. HIV/AIDS - people living with HIV/AIDS field listing
640,000 (2018 est.)
country comparison to the world: 14
HIV/AIDS - deaths: This entry gives an estimate of the number of adults and children who died of AIDS during a given calendar year. HIV/AIDS - deaths field listing
38,000 (2018 est.)
country comparison to the world: 5
Major infectious diseases: This entry lists major infectious diseases likely to be encountered in countries where the risk of such diseases is assessed to be very high as compared to the United States. These infectious diseases represent risks to US government personnel traveling to the specified country for a period of less than three years. The degree of risk is assessed by considering the foreign nature of these infectious diseases, their severity, and the probability of being affected by the diseases present. Th . . . more Major infectious diseases field listing
degree of risk: very high (2020)
food or waterborne diseases: bacterial diarrhea, hepatitis A, and typhoid fever
vectorborne diseases: dengue fever and malaria
Obesity - adult prevalence rate: This entry gives the percent of a country's population considered to be obese. Obesity is defined as an adult having a Body Mass Index (BMI) greater to or equal to 30.0. BMI is calculated by taking a person's weight in kg and dividing it by the person's squared height in meters. Obesity - adult prevalence rate field listing
6.9% (2016)
country comparison to the world: 162
Children under the age of 5 years underweight: This entry gives the percent of children under five considered to be underweight. Underweight means weight-for-age is approximately 2 kg below for standard at age one, 3 kg below standard for ages two and three, and 4 kg below standard for ages four and five. This statistic is an indicator of the nutritional status of a community. Children who suffer from growth retardation as a result of poor diets and/or recurrent infections tend to have a greater risk of suffering illness and death. Children under the age of 5 years underweight field listing
19.9% (2013)
country comparison to the world: 28
Education expenditures: This entry provides the public expenditure on education as a percent of GDP. Education expenditures field listing
3.6% of GDP (2015)
country comparison to the world: 120
Literacy: This entry includes a definition of literacy and UNESCO's percentage estimates for populations aged 15 years and over, including total population, males, and females. There are no universal definitions and standards of literacy. Unless otherwise specified, all rates are based on the most common definition - the ability to read and write at a specified age. Detailing the standards that individual countries use to assess the ability to read and write is beyond the scope of the Factbook. Info . . . more Literacy field listing
definition: age 15 and over can read and write
total population: 95.7%
male: 97.3%
female: 94% (2018)
School life expectancy (primary to tertiary education): School life expectancy (SLE) is the total number of years of schooling (primary to tertiary) that a child can expect to receive, assuming that the probability of his or her being enrolled in school at any particular future age is equal to the current enrollment ratio at that age. Caution must be maintained when utilizing this indicator in international comparisons. For example, a year or grade completed in one country is not necessarily the same in terms of educational content or qualit . . . more School life expectancy (primary to tertiary education) field listing
total: 13 years
male: 13 years
female: 13 years (2017)
Unemployment, youth ages 15-24: This entry gives the percent of the total labor force ages 15-24 unemployed during a specified year. Unemployment, youth ages 15-24 field listing
total: 16.5%
male: 16.5%
female: 16.5% (2018 est.)
country comparison to the world: 82
Government :: Indonesia
Country name: This entry includes all forms of the country's name approved by the US Board on Geographic Names (Italy is used as an example): conventional long form (Italian Republic), conventional short form (Italy), local long form (Repubblica Italiana), local short form (Italia), former (Kingdom of Italy), as well as the abbreviation. Also see the Terminology note. Country name field listing
conventional long form: Republic of Indonesia
conventional short form: Indonesia
local long form: Republik Indonesia
local short form: Indonesia
former: Netherlands East Indies, Dutch East Indies
etymology: the name is an 18th-century construct of two Greek words, "Indos" (India) and "nesoi" (islands), meaning "Indian islands"
Government type: This entry gives the basic form of government. Definitions of the major governmental terms are as follows. (Note that for some countries more than one definition applies.): Absolute monarchy - a form of government where the monarch rules unhindered, i.e., without any laws, constitution, or legally organized opposition. Anarchy - a condition of lawlessness or political disorder brought about by the absence of governmental authority. Authoritarian - a form of government in whic . . . more Government type field listing
presidential republic
Capital: This entry gives the name of the seat of government, its geographic coordinates, the time difference relative to Coordinated Universal Time (UTC) and the time observed in Washington, DC, and, if applicable, information on daylight saving time (DST). Where appropriate, a special note has been added to highlight those countries that have multiple time zones. Capital field listing
name: Jakarta
geographic coordinates: 6 10 S, 106 49 E
time difference: UTC+7 (12 hours ahead of Washington, DC, during Standard Time)
note: Indonesia has three time zones
etymology: "Jakarta" derives from the Sanscrit "Jayakarta" meaning "victorious city" and refers to a successful defeat and expulsion of the Portuguese in 1527; previously the port had been named "Sunda Kelapa"
Administrative divisions: This entry generally gives the numbers, designatory terms, and first-order administrative divisions as approved by the US Board on Geographic Names (BGN). Changes that have been reported but not yet acted on by the BGN are noted. Geographic names conform to spellings approved by the BGN with the exception of the omission of diacritical marks and special characters. Administrative divisions field listing
31 provinces (provinsi-provinsi, singular - provinsi), 1 autonomous province*, 1 special region** (daerah-daerah istimewa, singular - daerah istimewa), and 1 national capital district*** (daerah khusus ibukota); Aceh*, Bali, Banten, Bengkulu, Gorontalo, Jakarta***, Jambi, Jawa Barat (West Java), Jawa Tengah (Central Java), Jawa Timur (East Java), Kalimantan Barat (West Kalimantan), Kalimantan Selatan (South Kalimantan), Kalimantan Tengah (Central Kalimantan), Kalimantan Timur (East Kalimantan), Kalimantan Utara (North Kalimantan), Kepulauan Bangka Belitung (Bangka Belitung Islands), Kepulauan Riau (Riau Islands), Lampung, Maluku, Maluku Utara (North Maluku), Nusa Tenggara Barat (West Nusa Tenggara), Nusa Tenggara Timur (East Nusa Tenggara), Papua, Papua Barat (West Papua), Riau, Sulawesi Barat (West Sulawesi), Sulawesi Selatan (South Sulawesi), Sulawesi Tengah (Central Sulawesi), Sulawesi Tenggara (Southeast Sulawesi), Sulawesi Utara (North Sulawesi), Sumatera Barat (West Sumatra), Sumatera Selatan (South Sumatra), Sumatera Utara (North Sumatra), Yogyakarta**
note: following the implementation of decentralization beginning on 1 January 2001, regencies and municipalities have become the key administrative units responsible for providing most government services
Independence: For most countries, this entry gives the date that sovereignty was achieved and from which nation, empire, or trusteeship. For the other countries, the date given may not represent "independence" in the strict sense, but rather some significant nationhood event such as the traditional founding date or the date of unification, federation, confederation, establishment, fundamental change in the form of government, or state succession. For a number of countries, the establishment of statehood . . . more Independence field listing
17 August 1945 (declared independence from the Netherlands)
National holiday: This entry gives the primary national day of celebration - usually independence day. National holiday field listing
Independence Day, 17 August (1945)
Constitution: This entry provides information on a country’s constitution and includes two subfields. The history subfield includes the dates of previous constitutions and the main steps and dates in formulating and implementing the latest constitution. For countries with 1-3 previous constitutions, the years are listed; for those with 4-9 previous, the entry is listed as “several previous,” and for those with 10 or more, the entry is “many previous.” The amendments subfield summarizes the process of am . . . more Constitution field listing
history: drafted July to August 1945, effective 18 August 1945, abrogated by 1949 and 1950 constitutions; 1945 constitution restored 5 July 1959
amendments: proposed by the People’s Consultative Assembly, with at least two thirds of its members present; passage requires simple majority vote by the Assembly membership; constitutional articles on the unitary form of the state cannot be amended; amended several times, last in 2002 (2017)
Legal system: This entry provides the description of a country's legal system. A statement on judicial review of legislative acts is also included for a number of countries. The legal systems of nearly all countries are generally modeled upon elements of five main types: civil law (including French law, the Napoleonic Code, Roman law, Roman-Dutch law, and Spanish law); common law (including United State law); customary law; mixed or pluralistic law; and religious law (including Islamic law). An addition . . . more Legal system field listing
civil law system based on the Roman-Dutch model and influenced by customary law
International law organization participation: This entry includes information on a country's acceptance of jurisdiction of the International Court of Justice (ICJ) and of the International Criminal Court (ICCt); 59 countries have accepted ICJ jurisdiction with reservations and 11 have accepted ICJ jurisdiction without reservations; 122 countries have accepted ICCt jurisdiction. Appendix B: International Organizations and Groups explains the differing mandates of the ICJ and ICCt. International law organization participation field listing
has not submitted an ICJ jurisdiction declaration; non-party state to the ICCt
Citizenship: This entry provides information related to the acquisition and exercise of citizenship; it includes four subfields: citizenship by birth describes the acquisition of citizenship based on place of birth, known as Jus soli, regardless of the citizenship of parents. citizenship by descent only describes the acquisition of citizenship based on the principle of Jus sanguinis, or by descent, where at least one parent is a citizen of the state and being born within the territorial limits of the s . . . more Citizenship field listing
citizenship by birth: no
citizenship by descent only: at least one parent must be a citizen of Indonesia
dual citizenship recognized: no
residency requirement for naturalization: 5 continuous years
Suffrage: This entry gives the age at enfranchisement and whether the right to vote is universal or restricted. Suffrage field listing
17 years of age; universal and married persons regardless of age
Executive branch: This entry includes five subentries: chief of state; head of government; cabinet; elections/appointments; election results. Chief of state includes the name, title, and beginning date in office of the titular leader of the country who represents the state at official and ceremonial functions but may not be involved with the day-to-day activities of the government. Head of government includes the name, title of the top executive designated to manage the executive branch of the government, a . . . more Executive branch field listing
chief of state: President Joko WIDODO (since 20 October 2014, reelected 17 April 2019, inauguration 19 October 2019); Vice President Ma'ruf AMIN (since 20 October 2019); note - the president is both chief of state and head of government (2019)
head of government: President Joko WIDODO (since 20 October 2014); Vice President Ma'ruf AMIN (since 20 October 2019) (2019)
cabinet: Cabinet appointed by the president
elections/appointments: president and vice president directly elected by absolute majority popular vote for a 5-year term (eligible for a second term); election last held on 17 April 2019 (next election 2024)
election results: Joko WIDODO elected president; percent of vote - Joko WIDODO (PDI-P) 55.5%, PRABOWO Subianto Djojohadikusumo (GERINDRA) 44.5%
Legislative branch: This entry has three subfields. The description subfield provides the legislative structure (unicameral – single house; bicameral – an upper and a lower house); formal name(s); number of member seats; types of constituencies or voting districts (single seat, multi-seat, nationwide); electoral voting system(s); and member term of office. The elections subfield includes the dates of the last election and next election. The election results subfield lists percent of vote by party/coalition an . . . more Legislative branch field listing
description: bicameral People's Consultative Assembly or Majelis Permusyawaratan Rakyat consists of:
Regional Representative Council or Dewan Perwakilan Daerah (136 seats; non-partisan members directly elected in multi-seat constituencies - 4 each from the country's 34 electoral districts - by proportional representation vote to serve 5-year terms); note - the Regional Representative Council has no legislative authority
House of Representatives or Dewan Perwakilan Rakyat (575 seats; members directly elected in multi-seat constituencies by single non-transferable vote to serve 5-year terms) (2019)
elections: Regional Representative Council - last held 17 April 2019 (next to be held 2024)
House of Representatives - last held on 17 April 2019 (next to be held 2024) (2019)
election results: Regional Representative Council - all seats elected on a non-partisan basis; compostion - NA
House of Representatives - percent of vote by party - PDI-P 19.3%, Gerindra 12.6%, Golkar 12.3%, PKB 9.7%, Nasdem 9.1%, PKS 8.2%, PD 7.8%, PAN 6.8%, PPP 4.5%, other 9.6%; seats by party - PDI-P 128, Golkar 85, Gerindra 78, Nasdem 59, PKB 58, PD 54, PKS 50, PAN 44, PPP 19; composition - men 475, women 100, percent of women 17.9%; total People's Consultative Assembly percent of women NA (2019)
Judicial branch: This entry includes three subfields. The highest court(s) subfield includes the name(s) of a country's highest level court(s), the number and titles of the judges, and the types of cases heard by the court, which commonly are based on civil, criminal, administrative, and constitutional law. A number of countries have separate constitutional courts. The judge selection and term of office subfield includes the organizations and associated officials responsible for nominating and appointing j . . . more Judicial branch field listing
highest courts: Supreme Court or Mahkamah Agung (51 judges divided into 8 chambers); Constitutional Court or Mahkamah Konstitusi (consists of 9 judges)
judge selection and term of office: Supreme Court judges nominated by Judicial Commission, appointed by president with concurrence of parliament; judges serve until retirement at age 65; Constitutional Court judges - 3 nominated by president, 3 by Supreme Court, and 3 by parliament; judges appointed by the president; judges serve until mandatory retirement at age 70
subordinate courts: High Courts of Appeal, district courts, religious courts
Political parties and leaders: This entry includes a listing of significant political parties, coalitions, and electoral lists as of each country's last legislative election, unless otherwise noted. Political parties and leaders field listing
Democrat Party or PD [Susilo Bambang YUDHOYONO]
Functional Groups Party or GOLKAR [Airlangga HARTARTO]
Great Indonesia Movement Party or GERINDRA [PRABOWO Subianto Djojohadikusumo]
Indonesia Democratic Party-Struggle or PDI-P [MEGAWATI Sukarnoputri]
National Awakening Party or PKB [Muhaiman ISKANDAR]
National Democratic Party or NasDem [Surya PALOH]
National Mandate Party or PAN [Zulkifli HASAN]
Party of the Functional Groups or Golkar [Airlangga HARTARTO]
People's Conscience Party or HANURA [Oesman Sapta ODANG]
Prosperous Justice Party or PKS [Muhammad Sohibul IMAN]
United Development Party or PPP [Muhammad ROMAHURMUZIY] (2019)
International organization participation: This entry lists in alphabetical order by abbreviation those international organizations in which the subject country is a member or participates in some other way. International organization participation field listing
ADB, APEC, ARF, ASEAN, BIS, CD, CICA (observer), CP, D-8, EAS, EITI (compliant country), FAO, G-11, G-15, G-20, G-77, IAEA, IBRD, ICAO, ICC (national committees), ICRM, IDA, IDB, IFAD, IFC, IFRCS, IHO, ILO, IMF, IMO, IMSO, Interpol, IOC, IOM (observer), IORA, IPU, ISO, ITSO, ITU, ITUC (NGOs), MIGA, MINURSO, MINUSTAH, MONUSCO, MSG (associate member), NAM, OECD (enhanced engagement), OIC, OPCW, PIF (partner), UN, UNAMID, UNCTAD, UNESCO, UNIDO, UNIFIL, UNISFA, UNMIL, UNWTO, UPU, WCO, WFTU (NGOs), WHO, WIPO, WMO, WTO
Diplomatic representation in the US: This entry includes the chief of mission, chancery address, telephone, FAX, consulate general locations, and consulate locations. The use of the annotated title Appointed Ambassador refers to a new ambassador who has presented his/her credentials to the secretary of state but not the US president. Such ambassadors fulfill all diplomatic functions except meeting with or appearing at functions attended by the president until such time as they formally present their credentials at a White Hou . . . more Diplomatic representation in the US field listing
Ambassador Mahendra SIREGAR (since 8 April 2019)
chancery: 2020 Massachusetts Avenue NW, Washington, DC 20036
telephone: [1] (202) 775-5200
FAX: [1] (202) 775-5365
consulate(s) general: Chicago, Houston, Los Angeles, New York, San Francisco
Diplomatic representation from the US: This entry includes the chief of mission, embassy address, mailing address, telephone number, FAX number, branch office locations, consulate general locations, and consulate locations. Diplomatic representation from the US field listing
chief of mission: Ambassador Joseph R. DONOVAN, Jr. (since 12 January 2017)
telephone: [62] (21) 5083-1000 (2018)
embassy: Jalan Medan Merdeka Selatan 3-5, Jakarta 10110
mailing address: Unit 8129, Box 1, FPO AP 96520
FAX: [62] (21) 2395-1697 (2018)
consulate(s) general: Surabaya
consulate(s): Medan
Flag description: This entry provides a written flag description produced from actual flags or the best information available at the time the entry was written. The flags of independent states are used by their dependencies unless there is an officially recognized local flag. Some disputed and other areas do not have flags. Flag description field listing
two equal horizontal bands of red (top) and white; the colors derive from the banner of the Majapahit Empire of the 13th-15th centuries; red symbolizes courage, white represents purity
note: similar to the flag of Monaco, which is shorter; also similar to the flag of Poland, which is white (top) and red
National symbol(s): A national symbol is a faunal, floral, or other abstract representation - or some distinctive object - that over time has come to be closely identified with a country or entity. Not all countries have national symbols; a few countries have more than one. National symbol(s) field listing
garuda (mythical bird); national colors: red, white
National anthem: A generally patriotic musical composition - usually in the form of a song or hymn of praise - that evokes and eulogizes the history, traditions, or struggles of a nation or its people. National anthems can be officially recognized as a national song by a country's constitution or by an enacted law, or simply by tradition. Although most anthems contain lyrics, some do not. National anthem field listing
name: "Indonesia Raya" (Great Indonesia)
lyrics/music: Wage Rudolf SOEPRATMAN
note: adopted 1945
Economy :: Indonesia
Economy - overview: This entry briefly describes the type of economy, including the degree of market orientation, the level of economic development, the most important natural resources, and the unique areas of specialization. It also characterizes major economic events and policy changes in the most recent 12 months and may include a statement about one or two key future macroeconomic trends. Economy - overview field listing
Indonesia, the largest economy in Southeast Asia, has seen a slowdown in growth since 2012, mostly due to the end of the commodities export boom. During the global financial crisis, Indonesia outperformed its regional neighbors and joined China and India as the only G20 members posting growth. Indonesia’s annual budget deficit is capped at 3% of GDP, and the Government of Indonesia lowered its debt-to-GDP ratio from a peak of 100% shortly after the Asian financial crisis in 1999 to 34% today. In May 2017 Standard & Poor’s became the last major ratings agency to upgrade Indonesia’s sovereign credit rating to investment grade.
Poverty and unemployment, inadequate infrastructure, corruption, a complex regulatory environment, and unequal resource distribution among its regions are still part of Indonesia’s economic landscape. President Joko WIDODO - elected in July 2014 – seeks to develop Indonesia’s maritime resources and pursue other infrastructure development, including significantly increasing its electrical power generation capacity. Fuel subsidies were significantly reduced in early 2015, a move which has helped the government redirect its spending to development priorities. Indonesia, with the nine other ASEAN members, will continue to move towards participation in the ASEAN Economic Community, though full implementation of economic integration has not yet materialized.
GDP (purchasing power parity): This entry gives the gross domestic product (GDP) or value of all final goods and services produced within a nation in a given year. A nation's GDP at purchasing power parity (PPP) exchange rates is the sum value of all goods and services produced in the country valued at prices prevailing in the United States in the year noted. This is the measure most economists prefer when looking at per-capita welfare and when comparing living conditions or use of resources across countries. The measur . . . more GDP (purchasing power parity) field listing
$3.25 trillion (2017 est.)
$3.093 trillion (2016 est.)
$2.945 trillion (2015 est.)
note: data are in 2017 dollars
country comparison to the world: 7
GDP (official exchange rate): This entry gives the gross domestic product (GDP) or value of all final goods and services produced within a nation in a given year. A nation's GDP at official exchange rates (OER) is the home-currency-denominated annual GDP figure divided by the bilateral average US exchange rate with that country in that year. The measure is simple to compute and gives a precise measure of the value of output. Many economists prefer this measure when gauging the economic power an economy maintains vis- . . . more GDP (official exchange rate) field listing
$1.015 trillion (2017 est.)
GDP - real growth rate: This entry gives GDP growth on an annual basis adjusted for inflation and expressed as a percent. The growth rates are year-over-year, and not compounded. GDP - real growth rate field listing
5.1% (2017 est.)
5% (2016 est.)
4.9% (2015 est.)
country comparison to the world: 47
GDP - per capita (PPP): This entry shows GDP on a purchasing power parity basis divided by population as of 1 July for the same year. GDP - per capita (PPP) field listing
$12,400 (2017 est.)
$12,000 (2016 est.)
$11,500 (2015 est.)
note: data are in 2017 dollars
country comparison to the world: 127
Gross national saving: Gross national saving is derived by deducting final consumption expenditure (household plus government) from Gross national disposable income, and consists of personal saving, plus business saving (the sum of the capital consumption allowance and retained business profits), plus government saving (the excess of tax revenues over expenditures), but excludes foreign saving (the excess of imports of goods and services over exports). The figures are presented as a percent of GDP. A negative . . . more Gross national saving field listing
31.7% of GDP (2017 est.)
32% of GDP (2016 est.)
32% of GDP (2015 est.)
country comparison to the world: 27
GDP - composition, by end use: This entry shows who does the spending in an economy: consumers, businesses, government, and foreigners. The distribution gives the percentage contribution to total GDP of household consumption, government consumption, investment in fixed capital, investment in inventories, exports of goods and services, and imports of goods and services, and will total 100 percent of GDP if the data are complete. household consumption consists of expenditures by resident households, and by nonprofit insti . . . more GDP - composition, by end use field listing
household consumption: 57.3% (2017 est.)
government consumption: 9.1% (2017 est.)
investment in fixed capital: 32.1% (2017 est.)
investment in inventories: 0.3% (2017 est.)
exports of goods and services: 20.4% (2017 est.)
imports of goods and services: -19.2% (2017 est.)
GDP - composition, by sector of origin: This entry shows where production takes place in an economy. The distribution gives the percentage contribution of agriculture, industry, and services to total GDP, and will total 100 percent of GDP if the data are complete. Agriculture includes farming, fishing, and forestry. Industry includes mining, manufacturing, energy production, and construction. Services cover government activities, communications, transportation, finance, and all other private economic activities that do not prod . . . more GDP - composition, by sector of origin field listing
agriculture: 13.7% (2017 est.)
industry: 41% (2017 est.)
services: 45.4% (2017 est.)
Agriculture - products: This entry is an ordered listing of major crops and products starting with the most important. Agriculture - products field listing
rubber and similar products, palm oil, poultry, beef, forest products, shrimp, cocoa, coffee, medicinal herbs, essential oil, fish and its similar products, and spices
Industries: This entry provides a rank ordering of industries starting with the largest by value of annual output. Industries field listing
petroleum and natural gas, textiles, automotive, electrical appliances, apparel, footwear, mining, cement, medical instruments and appliances, handicrafts, chemical fertilizers, plywood, rubber, processed food, jewelry, and tourism
Industrial production growth rate: This entry gives the annual percentage increase in industrial production (includes manufacturing, mining, and construction). Industrial production growth rate field listing
4.1% (2017 est.)
country comparison to the world: 73
Labor force: This entry contains the total labor force figure. Labor force field listing
125 million (2016 est.)
country comparison to the world: 4
Labor force - by occupation: This entry lists the percentage distribution of the labor force by sector of occupation. Agriculture includes farming, fishing, and forestry. Industry includes mining, manufacturing, energy production, and construction. Services cover government activities, communications, transportation, finance, and all other economic activities that do not produce material goods. The distribution will total less than 100 percent if the data are incomplete and may range from 99-101 percent due to rounding. more Labor force - by occupation field listing
agriculture: 32%
industry: 21%
services: 47% (2016 est.)
Unemployment rate: This entry contains the percent of the labor force that is without jobs. Substantial underemployment might be noted. Unemployment rate field listing
5.4% (2017 est.)
5.6% (2016 est.)
country comparison to the world: 79
Population below poverty line: National estimates of the percentage of the population falling below the poverty line are based on surveys of sub-groups, with the results weighted by the number of people in each group. Definitions of poverty vary considerably among nations. For example, rich nations generally employ more generous standards of poverty than poor nations. Population below poverty line field listing
10.9% (2016 est.)
Household income or consumption by percentage share: Data on household income or consumption come from household surveys, the results adjusted for household size. Nations use different standards and procedures in collecting and adjusting the data. Surveys based on income will normally show a more unequal distribution than surveys based on consumption. The quality of surveys is improving with time, yet caution is still necessary in making inter-country comparisons. Household income or consumption by percentage share field listing
lowest 10%: 3.4%
highest 10%: 28.2% (2010)
Budget: This entry includes revenues, expenditures, and capital expenditures. These figures are calculated on an exchange rate basis, i.e., not in purchasing power parity (PPP) terms. Budget field listing
revenues: 131.7 billion (2017 est.)
expenditures: 159.6 billion (2017 est.)
Taxes and other revenues: This entry records total taxes and other revenues received by the national government during the time period indicated, expressed as a percent of GDP. Taxes include personal and corporate income taxes, value added taxes, excise taxes, and tariffs. Other revenues include social contributions - such as payments for social security and hospital insurance - grants, and net revenues from public enterprises. Normalizing the data, by dividing total revenues by GDP, enables easy comparisons acr . . . more Taxes and other revenues field listing
13% (of GDP) (2017 est.)
country comparison to the world: 208
Budget surplus (+) or deficit (-): This entry records the difference between national government revenues and expenditures, expressed as a percent of GDP. A positive (+) number indicates that revenues exceeded expenditures (a budget surplus), while a negative (-) number indicates the reverse (a budget deficit). Normalizing the data, by dividing the budget balance by GDP, enables easy comparisons across countries and indicates whether a national government saves or borrows money. Countries with high budget deficits (relat . . . more Budget surplus (+) or deficit (-) field listing
-2.7% (of GDP) (2017 est.)
country comparison to the world: 121
Public debt: This entry records the cumulative total of all government borrowings less repayments that are denominated in a country's home currency. Public debt should not be confused with external debt, which reflects the foreign currency liabilities of both the private and public sector and must be financed out of foreign exchange earnings. Public debt field listing
28.8% of GDP (2017 est.)
28.3% of GDP (2016 est.)
country comparison to the world: 166
Fiscal year: This entry identifies the beginning and ending months for a country's accounting period of 12 months, which often is the calendar year but which may begin in any month. All yearly references are for the calendar year (CY) unless indicated as a noncalendar fiscal year (FY). Fiscal year field listing
calendar year
Inflation rate (consumer prices): This entry furnishes the annual percent change in consumer prices compared with the previous year's consumer prices. Inflation rate (consumer prices) field listing
3.8% (2017 est.)
3.5% (2016 est.)
country comparison to the world: 150
Current account balance: This entry records a country's net trade in goods and services, plus net earnings from rents, interest, profits, and dividends, and net transfer payments (such as pension funds and worker remittances) to and from the rest of the world during the period specified. These figures are calculated on an exchange rate basis, i.e., not in purchasing power parity (PPP) terms. Current account balance field listing
-$17.33 billion (2017 est.)
-$16.95 billion (2016 est.)
country comparison to the world: 197
Exports: This entry provides the total US dollar amount of merchandise exports on an f.o.b. (free on board) basis. These figures are calculated on an exchange rate basis, i.e., not in purchasing power parity (PPP) terms. Exports field listing
$168.9 billion (2017 est.)
$144.4 billion (2016 est.)
country comparison to the world: 29
Exports - partners: This entry provides a rank ordering of trading partners starting with the most important; it sometimes includes the percent of total dollar value. Exports - partners field listing
China 13.6%, US 10.6%, Japan 10.5%, India 8.4%, Singapore 7.6%, Malaysia 5.1%, South Korea 4.8% (2017)
Exports - commodities: This entry provides a listing of the highest-valued exported products; it sometimes includes the percent of total dollar value. Exports - commodities field listing
mineral fuels, animal or vegetable fats (includes palm oil), electrical machinery, rubber, machinery and mechanical appliance parts
Imports: This entry provides the total US dollar amount of merchandise imports on a c.i.f. (cost, insurance, and freight) or f.o.b. (free on board) basis. These figures are calculated on an exchange rate basis, i.e., not in purchasing power parity (PPP) terms. Imports field listing
$150.1 billion (2017 est.)
$129.2 billion (2016 est.)
country comparison to the world: 31
Imports - commodities: This entry provides a listing of the highest-valued imported products; it sometimes includes the percent of total dollar value. Imports - commodities field listing
mineral fuels, boilers, machinery, and mechanical parts, electric machinery, iron and steel, foodstuffs
Imports - partners: This entry provides a rank ordering of trading partners starting with the most important; it sometimes includes the percent of total dollar value. Imports - partners field listing
China 23.2%, Singapore 10.9%, Japan 10%, Thailand 6%, Malaysia 5.6%, South Korea 5.3%, US 5.2% (2017)
Reserves of foreign exchange and gold: This entry gives the dollar value for the stock of all financial assets that are available to the central monetary authority for use in meeting a country's balance of payments needs as of the end-date of the period specified. This category includes not only foreign currency and gold, but also a country's holdings of Special Drawing Rights in the International Monetary Fund, and its reserve position in the Fund. Reserves of foreign exchange and gold field listing
$130.2 billion (31 December 2017 est.)
country comparison to the world: 19
Debt - external: This entry gives the total public and private debt owed to nonresidents repayable in internationally accepted currencies, goods, or services. These figures are calculated on an exchange rate basis, i.e., not in purchasing power parity (PPP) terms. Debt - external field listing
$344.4 billion (31 December 2017 est.)
country comparison to the world: 30
Exchange rates: This entry provides the average annual price of a country's monetary unit for the time period specified, expressed in units of local currency per US dollar, as determined by international market forces or by official fiat. The International Organization for Standardization (ISO) 4217 alphabetic currency code for the national medium of exchange is presented in parenthesis. Closing daily exchange rates are not presented in The World Factbook, but are used to convert stock values - e.g., the . . . more Exchange rates field listing
Indonesian rupiah (IDR) per US dollar -
13,385 (2017 est.)
13,308.3 (2016 est.)
13,308.3 (2015 est.)
13,389.4 (2014 est.)
11,865.2 (2013 est.)
Energy :: Indonesia
Electricity access: This entry provides information on access to electricity. Electrification data – collected from industry reports, national surveys, and international sources – consists of four subfields. Population without electricity provides an estimate of the number of citizens that do not have access to electricity. Electrification – total population is the percent of a country’s total population with access to electricity, electrification – urban areas is the percent of a country’s urban population w . . . more Electricity access field listing
population without electricity: 14 million (2017)
electrification - total population: 97.6% (2016)
electrification - urban areas: 100% (2016)
electrification - rural areas: 94.8% (2016)
Electricity - production: This entry is the annual electricity generated expressed in kilowatt-hours. The discrepancy between the amount of electricity generated and/or imported and the amount consumed and/or exported is accounted for as loss in transmission and distribution. Electricity - production field listing
235.4 billion kWh (2016 est.)
country comparison to the world: 20
Electricity - consumption: This entry consists of total electricity generated annually plus imports and minus exports, expressed in kilowatt-hours. The discrepancy between the amount of electricity generated and/or imported and the amount consumed and/or exported is accounted for as loss in transmission and distribution. Electricity - consumption field listing
213.4 billion kWh (2016 est.)
country comparison to the world: 20
Electricity - exports: This entry is the total exported electricity in kilowatt-hours. Electricity - exports field listing
0 kWh (2017 est.)
country comparison to the world: 149
Electricity - imports: This entry is the total imported electricity in kilowatt-hours. Electricity - imports field listing
693 million kWh (2016 est.)
country comparison to the world: 76
Electricity - installed generating capacity: This entry is the total capacity of currently installed generators, expressed in kilowatts (kW), to produce electricity. A 10-kilowatt (kW) generator will produce 10 kilowatt hours (kWh) of electricity, if it runs continuously for one hour. Electricity - installed generating capacity field listing
61.43 million kW (2016 est.)
country comparison to the world: 19
Electricity - from fossil fuels: This entry measures the capacity of plants that generate electricity by burning fossil fuels (such as coal, petroleum products, and natural gas), expressed as a share of the country's total generating capacity. Electricity - from fossil fuels field listing
85% of total installed capacity (2016 est.)
country comparison to the world: 71
Electricity - from nuclear fuels: This entry measures the capacity of plants that generate electricity through radioactive decay of nuclear fuel, expressed as a share of the country's total generating capacity. Electricity - from nuclear fuels field listing
0% of total installed capacity (2017 est.)
country comparison to the world: 110
Electricity - from hydroelectric plants: This entry measures the capacity of plants that generate electricity by water-driven turbines, expressed as a share of the country's total generating capacity. Electricity - from hydroelectric plants field listing
9% of total installed capacity (2017 est.)
country comparison to the world: 118
Electricity - from other renewable sources: This entry measures the capacity of plants that generate electricity by using renewable energy sources other than hydroelectric (including, for example, wind, waves, solar, and geothermal), expressed as a share of the country's total generating capacity. Electricity - from other renewable sources field listing
6% of total installed capacity (2017 est.)
country comparison to the world: 99
Crude oil - production: This entry is the total amount of crude oil produced, in barrels per day (bbl/day). Crude oil - production field listing
772,000 bbl/day (2018 est.)
country comparison to the world: 24
Crude oil - exports: This entry is the total amount of crude oil exported, in barrels per day (bbl/day). Crude oil - exports field listing
302,300 bbl/day (2015 est.)
country comparison to the world: 27
Crude oil - imports: This entry is the total amount of crude oil imported, in barrels per day (bbl/day). Crude oil - imports field listing
498,500 bbl/day (2015 est.)
country comparison to the world: 18
Crude oil - proved reserves: This entry is the stock of proved reserves of crude oil, in barrels (bbl). Proved reserves are those quantities of petroleum which, by analysis of geological and engineering data, can be estimated with a high degree of confidence to be commercially recoverable from a given date forward, from known reservoirs and under current economic conditions. Crude oil - proved reserves field listing
3.31 billion bbl (1 January 2018 est.)
country comparison to the world: 28
Refined petroleum products - production: This entry is the country's total output of refined petroleum products, in barrels per day (bbl/day). The discrepancy between the amount of refined petroleum products produced and/or imported and the amount consumed and/or exported is due to the omission of stock changes, refinery gains, and other complicating factors. Refined petroleum products - production field listing
950,000 bbl/day (2015 est.)
country comparison to the world: 18
Refined petroleum products - consumption: This entry is the country's total consumption of refined petroleum products, in barrels per day (bbl/day). The discrepancy between the amount of refined petroleum products produced and/or imported and the amount consumed and/or exported is due to the omission of stock changes, refinery gains, and other complicating factors. Refined petroleum products - consumption field listing
1.601 million bbl/day (2016 est.)
country comparison to the world: 14
Refined petroleum products - exports: This entry is the country's total exports of refined petroleum products, in barrels per day (bbl/day). Refined petroleum products - exports field listing
79,930 bbl/day (2015 est.)
country comparison to the world: 47
Refined petroleum products - imports: This entry is the country's total imports of refined petroleum products, in barrels per day (bbl/day). Refined petroleum products - imports field listing
591,500 bbl/day (2015 est.)
country comparison to the world: 15
Natural gas - production: This entry is the total natural gas produced in cubic meters (cu m). The discrepancy between the amount of natural gas produced and/or imported and the amount consumed and/or exported is due to the omission of stock changes and other complicating factors. Natural gas - production field listing
72.09 billion cu m (2017 est.)
country comparison to the world: 12
Natural gas - consumption: This entry is the total natural gas consumed in cubic meters (cu m). The discrepancy between the amount of natural gas produced and/or imported and the amount consumed and/or exported is due to the omission of stock changes and other complicating factors. Natural gas - consumption field listing
42.32 billion cu m (2017 est.)
country comparison to the world: 23
Natural gas - exports: This entry is the total natural gas exported in cubic meters (cu m). Natural gas - exports field listing
29.78 billion cu m (2017 est.)
country comparison to the world: 12
Natural gas - imports: This entry is the total natural gas imported in cubic meters (cu m). Natural gas - imports field listing
0 cu m (2017 est.)
country comparison to the world: 141
Natural gas - proved reserves: This entry is the stock of proved reserves of natural gas in cubic meters (cu m). Proved reserves are those quantities of natural gas, which, by analysis of geological and engineering data, can be estimated with a high degree of confidence to be commercially recoverable from a given date forward, from known reservoirs and under current economic conditions. Natural gas - proved reserves field listing
2.866 trillion cu m (1 January 2018 est.)
country comparison to the world: 12
Carbon dioxide emissions from consumption of energy: This entry is the total amount of carbon dioxide, measured in metric tons, released by burning fossil fuels in the process of producing and consuming energy. Carbon dioxide emissions from consumption of energy field listing
540.7 million Mt (2017 est.)
country comparison to the world: 12
Communications :: Indonesia
Telephones - fixed lines: This entry gives the total number of fixed telephone lines in use, as well as the number of subscriptions per 100 inhabitants. Telephones - fixed lines field listing
total subscriptions: 8,303,511
subscriptions per 100 inhabitants: 3 (2018 est.)
country comparison to the world: 19
Telephones - mobile cellular: This entry gives the total number of mobile cellular telephone subscribers, as well as the number of subscriptions per 100 inhabitants. Note that because of the ubiquity of mobile phone use in developed countries, the number of subscriptions per 100 inhabitants can exceed 100. Telephones - mobile cellular field listing
total subscriptions: 319,434,605
subscriptions per 100 inhabitants: 122 (2018 est.)
country comparison to the world: 4
Telecommunication systems: This entry includes a brief general assessment of the telecommunications system with details on the domestic and international components. The following terms and abbreviations are used throughout the entry: Arabsat - Arab Satellite Communications Organization (Riyadh, Saudi Arabia). Autodin - Automatic Digital Network (US Department of Defense). CB - citizen's band mobile radio communications. Cellular telephone system - the telephones in this system are radio transceivers, with each inst . . . more Telecommunication systems field listing
general assessment: international service good; Indonesia has very low fixed line and fixed broadband penetration, high mobile penetration and moderate mobile broadband penetration; 4G mobile services are relatively advanced, 7 operators compete for revenue in the Indonesian market; Chinese company Huawei and LTE work on the development of 5G technology in the country; mobile broadband market still in early stages of development; data center market has experienced significant growth; Kacific-1 satellite launched in 2019 to significantly improve telecommunications (2020)
domestic: fixed-line 3 per 100 and mobile-cellular 122 per 100 persons; coverage provided by existing network has been expanded by use of over 200,000 telephone kiosks many located in remote areas; mobile-cellular subscribership growing rapidly (2018)
international: country code - 62; landing points for the SEA-ME-WE-3 & 5, DAMAI, JASUKA, BDM, Dumai-Melaka Cable System, IGG, JIBA, Link 1, 3, 4, & 5, PGASCOM, B3J2, Tanjung Pandam-Sungai Kakap Cable System, JAKABARE, JAYABAYA, INDIGO-West, Matrix Cable System, ASC, SJJK, Jaka2LaDeMa, S-U-B Cable System, JBCS, MKCS, BALOK, Palapa Ring East, West and Middle, SMPCS Packet-1 and 2, LTCS, TSCS, SEA-US and Kamal Domestic Submarine Cable System, 35 submarine cable networks that provide links throughout Asia, the Middle East, Australia, Southeast Asia, Africa and Europe; satellite earth stations - 2 Intelsat (1 Indian Ocean and 1 Pacific Ocean) (2019)
the COVID-19 outbreak is negatively impacting telecommunications production and supply chains globally; consumer spending on telecom devices and services has also slowed due to the pandemic's effect on economies worldwide; overall progress towards improvements in all facets of the telecom industry - mobile, fixed-line, broadband, submarine cable and satellite - has moderated
Broadcast media: This entry provides information on the approximate number of public and private TV and radio stations in a country, as well as basic information on the availability of satellite and cable TV services. Broadcast media field listing
mixture of about a dozen national TV networks - 1 public broadcaster, the remainder private broadcasters - each with multiple transmitters; more than 100 local TV stations; widespread use of satellite and cable TV systems; public radio broadcaster operates 6 national networks, as well as regional and local stations; overall, more than 700 radio stations with more than 650 privately operated (2019)
Internet country code: This entry includes the two-letter codes maintained by the International Organization for Standardization (ISO) in the ISO 3166 Alpha-2 list and used by the Internet Assigned Numbers Authority (IANA) to establish country-coded top-level domains (ccTLDs). Internet country code field listing
.id
Internet users: This entry gives the total number of individuals within a country who can access the Internet at home, via any device type (computer or mobile) and connection. The percent of population with Internet access (i.e., the penetration rate) helps gauge how widespread Internet use is within a country. Statistics vary from country to country and may include users who access the Internet at least several times a week to those who access it only once within a period of several months. Internet users field listing
total: 65,525,226
percent of population: 25.4% (July 2016 est.)
country comparison to the world: 10
Broadband - fixed subscriptions: This entry gives the total number of fixed-broadband subscriptions, as well as the number of subscriptions per 100 inhabitants. Fixed broadband is a physical wired connection to the Internet (e.g., coaxial cable, optical fiber) at speeds equal to or greater than 256 kilobits/second (256 kbit/s). Broadband - fixed subscriptions field listing
total: 8,874,116
subscriptions per 100 inhabitants: 3 (2018 est.)
country comparison to the world: 20
Military and Security :: Indonesia
Military expenditures: This entry gives spending on defense programs for the most recent year available as a percent of gross domestic product (GDP); the GDP is calculated on an exchange rate basis, i.e., not in terms of purchasing power parity (PPP). For countries with no military forces, this figure can include expenditures on public security and police. Military expenditures field listing
0.7% of GDP (2019)
0.7% of GDP (2018)
0.9% of GDP (2017)
0.8% of GDP (2016)
0.9% of GDP (2015)
country comparison to the world: 135
Military and security forces: This entry lists the military and security forces subordinate to defense ministries or the equivalent (typically ground, naval, air, and marine forces), as well as those belonging to interior ministries or the equivalent (typically gendarmeries, border/coast guards, paramilitary police, and other internal security forces). Military and security forces field listing
Indonesian National Armed Forces (Tentara Nasional Indonesia, TNI): Army (TNI-Angkatan Darat (TNI-AD)), Navy (TNI-Angkatan Laut (TNI-AL), includes marines (Korps Marinir, KorMar), naval air arm), Air Force (TNI-Angkatan Udara (TNI-AU)), National Air Defense Command (Komando Pertahanan Udara Nasional (Kohanudnas)), Armed Forces Special Operations Command (Koopssus), Strategic Reserve Command (Kostrad) (2019)
note: the Indonesian National Police includes a paramilitary Mobile Brigade Corps (BRIMOB)
Military service age and obligation: This entry gives the required ages for voluntary or conscript military service and the length of service obligation. Military service age and obligation field listing
18-45 years of age for voluntary military service, with selective conscription authorized; 2-year service obligation, with reserve obligation to age 45 (officers); Indonesian citizens only (2013)
Maritime threats: This entry describes the threat of piracy, as defined in Article 101, UN Convention on the Law of the Sea (UNCLOS), or armed robbery against ships, as defined in Resolution A. 1025 (26) adopted on 2 December 2009 at the 26th Assembly Session of the International Maritime Organization. The entry includes the number of ships on the high seas or in territorial waters that were boarded or attacked by pirates, and the number of crewmen abducted or killed, as compiled by the International Mariti . . . more Maritime threats field listing
The International Maritime Bureau continues to report the territorial and offshore waters in the Strait of Malacca and South China Sea as high risk for piracy and armed robbery against ships; attacks declined for the third year in a row from 43 incidents in 2016 to 36 in 2018 due to aggressive maritime patrolling by regional authorities; in 2018, 29 commercial vessels were boarded and three crew members were taken hostage; hijacked vessels are often disguised and cargo diverted to ports in East Asia (2018)
Transportation :: Indonesia
National air transport system: This entry includes four subfields describing the air transport system of a given country in terms of both structure and performance. The first subfield, number of registered air carriers, indicates the total number of air carriers registered with the country’s national aviation authority and issued an air operator certificate as required by the Convention on International Civil Aviation. The second subfield, inventory of registered aircraft operated by air carriers, lists the total number . . . more National air transport system field listing
number of registered air carriers: 29 (2015)
inventory of registered aircraft operated by air carriers: 550 (2015)
annual passenger traffic on registered air carriers: 88,685,767 (2015)
annual freight traffic on registered air carriers: 747,473,207 mt-km (2015)
Civil aircraft registration country code prefix: This entry provides the one- or two-character alphanumeric code indicating the nationality of civil aircraft. Article 20 of the Convention on International Civil Aviation (Chicago Convention), signed in 1944, requires that all aircraft engaged in international air navigation bear appropriate nationality marks. The aircraft registration number consists of two parts: a prefix consisting of a one- or two-character alphanumeric code indicating nationality and a registration suffix of one to fi . . . more Civil aircraft registration country code prefix field listing
PK (2016)
Airports: This entry gives the total number of airports or airfields recognizable from the air. The runway(s) may be paved (concrete or asphalt surfaces) or unpaved (grass, earth, sand, or gravel surfaces) and may include closed or abandoned installations. Airports or airfields that are no longer recognizable (overgrown, no facilities, etc.) are not included. Note that not all airports have accommodations for refueling, maintenance, or air traffic control. Airports field listing
673 (2013)
country comparison to the world: 10
Airports - with paved runways: This entry gives the total number of airports with paved runways (concrete or asphalt surfaces) by length. For airports with more than one runway, only the longest runway is included according to the following five groups - (1) over 3,047 m (over 10,000 ft), (2) 2,438 to 3,047 m (8,000 to 10,000 ft), (3) 1,524 to 2,437 m (5,000 to 8,000 ft), (4) 914 to 1,523 m (3,000 to 5,000 ft), and (5) under 914 m (under 3,000 ft). Only airports with usable runways are included in this listing. Not all . . . more Airports - with paved runways field listing
total: 186 (2017)
over 3,047 m: 5 (2017)
2,438 to 3,047 m: 21 (2017)
1,524 to 2,437 m: 51 (2017)
914 to 1,523 m: 72 (2017)
under 914 m: 37 (2017)
Airports - with unpaved runways: This entry gives the total number of airports with unpaved runways (grass, dirt, sand, or gravel surfaces) by length. For airports with more than one runway, only the longest runway is included according to the following five groups - (1) over 3,047 m (over 10,000 ft), (2) 2,438 to 3,047 m (8,000 to 10,000 ft), (3) 1,524 to 2,437 m (5,000 to 8,000 ft), (4) 914 to 1,523 m (3,000 to 5,000 ft), and (5) under 914 m (under 3,000 ft). Only airports with usable runways are included in this listin . . . more Airports - with unpaved runways field listing
total: 487 (2013)
1,524 to 2,437 m: 4 (2013)
914 to 1,523 m: 23 (2013)
under 914 m: 460 (2013)
Heliports: This entry gives the total number of heliports with hard-surface runways, helipads, or landing areas that support routine sustained helicopter operations exclusively and have support facilities including one or more of the following facilities: lighting, fuel, passenger handling, or maintenance. It includes former airports used exclusively for helicopter operations but excludes heliports limited to day operations and natural clearings that could support helicopter landings and takeoffs. Heliports field listing
76 (2013)
Pipelines: This entry gives the lengths and types of pipelines for transporting products like natural gas, crude oil, or petroleum products. Pipelines field listing
1064 km condensate, 150 km condensate/gas, 11702 km gas, 119 km liquid petroleum gas, 7767 km oil, 77 km oil/gas/water, 728 km refined products, 53 km unknown, 44 km water (2013)
Railways: This entry states the total route length of the railway network and of its component parts by gauge, which is the measure of the distance between the inner sides of the load-bearing rails. The four typical types of gauges are: broad, standard, narrow, and dual. Other gauges are listed under note. Some 60% of the world's railways use the standard gauge of 1.4 m (4.7 ft). Gauges vary by country and sometimes within countries. The choice of gauge during initial construction was mainly in resp . . . more Railways field listing
total: 8,159 km (2014)
narrow gauge: 8,159 km 1.067-m gauge (565 km electrified) (2014)
note: 4,816 km operational
country comparison to the world: 27
Roadways: This entry gives the total length of the road network and includes the length of the paved and unpaved portions. Roadways field listing
total: 496,607 km (2011)
paved: 283,102 km (2011)
unpaved: 213,505 km (2011)
country comparison to the world: 14
Waterways: This entry gives the total length of navigable rivers, canals, and other inland bodies of water. Waterways field listing
21,579 km (2011)
country comparison to the world: 7
Merchant marine: This entry provides the total and the number of each type of privately or publicly owned commercial ship for each country; military ships are not included; the five ships by type include: bulk carrier - for cargo such as coal, grain, cement, ores, and gravel; container ship - for loads in truck-size containers, a transportation system called containerization; general cargo - also referred to as break-bulk containers - for a wide variety of packaged merchandise, such as textiles, furniture . . . more Merchant marine field listing
total: 9,879
by type: bulk carrier 109, container ship 217, general cargo 2,198, oil tanker 622, other 6,733 (2019)
country comparison to the world: 1
Ports and terminals: This entry lists major ports and terminals primarily on the basis of the amount of cargo tonnage shipped through the facilities on an annual basis. In some instances, the number of containers handled or ship visits were also considered. Most ports service multiple classes of vessels including bulk carriers (dry and liquid), break bulk cargoes (goods loaded individually in bags, boxes, crates, or drums; sometimes palletized), containers, roll-on/roll-off, and passenger ships. The listing le . . . more Ports and terminals field listing
major seaport(s): Banjarmasin, Belawan, Kotabaru, Krueg Geukueh, Palembang, Panjang, Sungai Pakning, Tanjung Perak, Tanjung Priok
container port(s) (TEUs): Tanjung Perak (3,553,370), Tanjung Priok (6,090,000) (2017)
LNG terminal(s) (export): Bontang, Tangguh
LNG terminal(s) (import): Arun, Lampung, West Java
Terrorism :: Indonesia
Terrorist groups - home based: This entry provides information on the US State Department's designated Foreign Terrorist Organizations headquartered in a specific country, which may or may not be a group's country of origin. Details on each organization's aim(s) and area(s) of operation are provided. Terrorist groups - home based field listing
ISIS-associated Jemaah Anshorut Daulah (JAD): aim(s): establish an Islamic caliphate in Indonesia
area(s) of operation: an ISIS-aligned coalition of cells located throughout the country (2018)
Islamic State of Iraq and ash-Sham (ISIS) network in Indonesia: aim(s): replace the Indonesian Government with an Islamic state and implement ISIS's strict interpretation of sharia
area(s) of operation: maintains a covert operational presence (2018)
Jemaah Islamiyah (JI): aim(s): overthrow the Indonesian Government and, ultimately, establish a pan-Islamic state across Southeast Asia
area(s) of operation: Indonesia (2018)
Transnational Issues :: Indonesia
Disputes - international: This entry includes a wide variety of situations that range from traditional bilateral boundary disputes to unilateral claims of one sort or another. Information regarding disputes over international terrestrial and maritime boundaries has been reviewed by the US Department of State. References to other situations involving borders or frontiers may also be included, such as resource disputes, geopolitical questions, or irredentist issues; however, inclusion does not necessarily constitute . . . more Disputes - international field listing
Indonesia has a stated foreign policy objective of establishing stable fixed land and maritime boundaries with all of its neighbors; three stretches of land borders with Timor-Leste have yet to be delimited, two of which are in the Oecussi exclave area, and no maritime or Exclusive Economic Zone (EEZ) boundaries have been established between the countries; all borders between Indonesia and Australia have been agreed upon bilaterally, but a 1997 treaty that would settle the last of their maritime and EEZ boundary has yet to be ratified by Indonesia's legislature; Indonesian groups challenge Australia's claim to Ashmore Reef; Australia has closed parts of the Ashmore and Cartier Reserve to Indonesian traditional fishing and placed restrictions on certain catches; land and maritime negotiations with Malaysia are ongoing, and disputed areas include the controversial Tanjung Datu and Camar Wulan border area in Borneo and the maritime boundary in the Ambalat oil block in the Celebes Sea; Indonesia and Singapore continue to work on finalizing their 1973 maritime boundary agreement by defining unresolved areas north of Indonesia's Batam Island; Indonesian secessionists, squatters, and illegal migrants create repatriation problems for Papua New Guinea; maritime delimitation talks continue with Palau; EEZ negotiations with Vietnam are ongoing, and the two countries in Fall 2011 agreed to work together to reduce illegal fishing along their maritime boundary
Refugees and internally displaced persons: This entry includes those persons residing in a country as refugees, internally displaced persons (IDPs), or stateless persons. Each country's refugee entry includes only countries of origin that are the source of refugee populations of 5,000 or more. The definition of a refugee according to a UN Convention is "a person who is outside his/her country of nationality or habitual residence; has a well-founded fear of persecution because of his/her race, religion, nationality, membership in a . . . more Refugees and internally displaced persons field listing
refugees (country of origin): 6,098 (Afghanistan) (2018)
IDPs: 16,000 (inter-communal, inter-faith, and separatist violence between 1998 and 2004 in Aceh and Papua; religious attacks and land conflicts in 2012 and 2013; most IDPs in Aceh, Maluku, East Nusa Tengarra) (2018)
Illicit drugs: This entry gives information on the five categories of illicit drugs - narcotics, stimulants, depressants (sedatives), hallucinogens, and cannabis. These categories include many drugs legally produced and prescribed by doctors as well as those illegally produced and sold outside of medical channels. Cannabis (Cannabis sativa) is the common hemp plant, which provides hallucinogens with some sedative properties, and includes marijuana (pot, Acapulco gold, grass, reefer), tetrahydroca . . . more Illicit drugs field listing
illicit producer of cannabis largely for domestic use; producer of methamphetamine and ecstasy; President WIDODO's war on drugs has led to an increase in death sentences and executions, particularly of foreign drug traffickers
