
.
A Racial Study of the Fijians , Norman E. Gabel
Illustration: Simplified map of Fiji showing four regional divisions of population made by the author.
A RACIAL STUDY OF THE FIJIANS
BY
NORMAN E. GABEL
ANTHROPOLOGICAL RECORDS
Vol. 20, No. I
UNIVERSITY OF CALIFORNIA
ANTHROPOLOGICAL RECORDS
Editors: C. W. Meighan, Harry Hoijer. Eshref Shevky
Volume 20, No. 1. pp. 1-44, plates 1-15
Submitted by editors April 11, 1957
Issued March 27, 1958
Price. $1.00
University of California Press
Berkeley and Los Angeles
California
Cambridge University Press
London, England
Manufactured in the United States of America
CONTENTS
CONTENTS
MEASUREMENTS AND INDICES
MORPHOLOGICAL OBSERVATIONS
CONCLUSIONS
LITERATURE CITED
PLATES
| Page | |
| Introduction | 1 |
| The problem and procedure | 1 |
| The habitat | 2 |
| History | 3 |
| Population | 3 |
| Racial background | 4 |
| Acknowledgments | 4 |
| Measurements and indices | 5 |
| General | 5 |
| Weight | 5 |
| Stature | 5 |
| Span | 5 |
| Span-stature index | 5 |
| The trunk | 5 |
| Sitting height | 5 |
| Relative sitting height | 5 |
| Biacromial | 6 |
| Relative shoulder breadth | 6 |
| Bi-iliac | 6 |
| Shoulder-hip | 6 |
| Chest breadth | 6 |
| Chest depth | 6 |
| Thoracic | 6 |
| Arms and legs | 6 |
| Arm length | 6 |
| Humeral length | 6 |
| Radial length | 7 |
| Radial-humeral | 7 |
| Leg length | 7 |
| Tibial length | 7 |
| Calf circumference | 7 |
| The head | 7 |
| Head circumference | 7 |
| Head length | 7 |
| Head breadth | 7 |
| Cephalic index | 7 |
| Head height | 8 |
| Length-height | 8 |
| Breadth-height | 8 |
| Cranial module | 8 |
| Minimum frontal | 8 |
| Fronto-parietal | 8 |
| The face | 8 |
| Bizygomatic | 8 |
| Cephalo-facial | 9 |
| Zygo-frontal | 9 |
| Total face height | 9 |
| Total facial index | 9 |
| Upper face height | 9 |
| Upper facial index | 9 |
| Bigonial | 9 |
| Fronto-gonial | 9 |
| Zygo-gonial | 10 |
| Nasal height | 10 |
| Nasal breadth | 10 |
| Nasal index | 10 |
| Nasal depth | 10 |
| Nasal-depth index | 10 |
| Mouth breadth | 10 |
| Lip thickness | 10 |
| Ear length | 10 |
| Ear breadth | 11 |
| Ear index | 11 |
| Bicanine breadth | 11 |
| Morphological observations | 12 |
| Pigmentation | 12 |
| Skin color: exposed | 12 |
| Skin color: unexposed | 12 |
| Hair color | 13 |
| Eye color | 13 |
| Hair | 13 |
| Hair form | 13 |
| Hair texture | 14 |
| Head hair quantity | 14 |
| Hair length | 14 |
| Baldness | 14 |
| Beard quantity | 14 |
| Body hair | 15 |
| Grayness: head | 15 |
| Grayness: beard | 16 |
| The face | 16 |
| Prognathism: total | 16 |
| Prognathism: mid-facial | 16 |
| Prognathism: alveolar | 16 |
| Malar projection: lateral | 16 |
| Malar projection: frontal | 16 |
| Gonial angles | 16 |
| Palate shape | 16 |
| Chin prominence | 17 |
| Chin type | 17 |
| The head | 17 |
| Temporal fullness | 17 |
| Occipital protrusion | 17 |
| Lambdoidal flattening | 17 |
| Occipital flattening | 17 |
| Median sagittal crest | 17 |
| Parietal bosses | 17 |
| Cranial asymmetry | 17 |
| Facial asymmetry | 18 |
| Eyes | 18 |
| Eye folds: external | 18 |
| Eye fold: median | 18 |
| Eye folds: internal | 18 |
| Eye obliquity | 18 |
| Eye opening | 18 |
| Forehead | 18 |
| Brow ridges | 18 |
| Forehead height | 19 |
| Forehead slope | 19 |
| Nose | 19 |
| Nasion depression | 19 |
| Root height | 19 |
| Root breadth | 19 |
| Nasal septum | 19 |
| Bridge height | 19 |
| Bridge breadth | 19 |
| Nasal profile | 19 |
| Nasal-tip thickness | 20 |
| Nasal-tip inclination | 20 |
| Nasal wings | 20 |
| Mouth | 20 |
| Lip thickness: membranous | 20 |
| Lip thickness: integumental | 20 |
| Lip eversion | 20 |
| Lip seam | 20 |
| Teeth | 21 |
| Bite | 21 |
| Caries | 21 |
| Crowding | 21 |
| Tooth eruption | 21 |
| Wear | 21 |
| Ears | 21 |
| Ear helix | 21 |
| Darwin's point | 21 |
| Ear-lobe type | 22 |
| Ear-lobe size | 22 |
| Ear protrusion | 22 |
| Ear slant | 22 |
| Body build | 22 |
| Body build: endomorph | 22 |
| Body build: mesomorph | 22 |
| Body build: ectomorph | 22 |
| Summary | 23 |
| Conclusions | 25 |
| Literature cited | 26 |
| Plates | 27 |
MAP
Simplified map of Fiji showing four regional divisions of population made by the author ... frontispiece
A RACIAL STUDY OF THE FIJIANS
BY
NORMAN E. GABEL
INTRODUCTION
This paper concerns itself with a physical survey of the native male population of Fiji. The main objective is a description of these people by means of anthropometric procedure.[1] The treatment includes, first, a description of the Fijians as a whole, second, a comparison with neighboring people, and third, regional differences among the Fijians themselves.
THE PROBLEM AND PROCEDURE
The data used in this survey were secured in 1954 during a stay of seven months in Fiji. My plan was to obtain anthropometric samples from several parts of the archipelago; this plan was only slightly altered as time and transportation facilities directed. Each of the three main administrative districts into which the islands are divided were visited and within each district samples were secured from most of the constituent provinces. The original sample consisted of 880 subjects. Later, 65 subjects were excluded for various reasons: some were part Samoan or Tongan, a few were Rotumans, and others were immature. The number finally used stands at 815.
A limited amount of comparative material has been included in order to help locate the Fijians in the overall Pacific picture. These data were drawn from W. W. Howells, "Anthropometry and Blood Types in Fiji and the Solomon Islands" in The American Museum of Natural History, Anthropological Papers, volume 33, part 4, 1933, and from L. R. Sullivan, "A Contribution to Tongan Somatology" based on the field studies of E. W. Gifford and W. C. McKern, in Memoires of the Bernice P. Bishop Museum, volume 8, number 4, 1922. The latter report provides comparison with what may be termed western Polynesians who are also the nearest Polynesians to the Fijians. The Fijian data in Howell's paper make it possible for me to check some of my own Fijian material, and the Solomon Island data in the same report provide a Melanesian measuring stick.
Since an over-all description of the Fijians is the initial concern of this paper, each physical trait measured or derived from measurement is tabulated according to range, average, and deviation. Traits observed but not measured are presented according to degree of development, e.g., absent, medium, and pronounced, and according to percentage of occurrence. Further statistical manipulation is not deemed necessary for the writer's purposes.
It is well established that the Fijians are a mixed people. They are regarded, and with good reason, as a hybrid of, mainly, Melanesian and Polynesian components. Their geographical location, their history, and their physical appearance bear this out.
The proportions of Polynesian and Melanesian elements are, of course, not evenly distributed throughout Fiji. Even superficial observation indicates that the natives range from strongly Melanesian to markedly Polynesian. To demonstrate how this variability follows certain regional trends, the data have been broken down into four geographical areas. This subdivision rests on several considerations and merits further comment.
One of the subgroups represents the people of the mountainous interior of Viti Levu, the main island of Fiji (see accompanying map). This region may be regarded as something of a refuge area. Fijians from this relatively isolated locality might reasonably be expected to exhibit more of the earlier racial elements of the total composition. It should be pointed out, however, that the degree of isolation associated with this; interior; group is not extreme. Fiji tradition and history indicate extensive interregional movement. Particularly in early historic times, when the advent of firearms and other Western culture greatly stimulated intergroup warfare and cannibalism, there was much moving about from one region to another. With all this, the interior people still remained, as indeed they are today, more apart from the rest of the population and less subject to outside influence.
The second segment chosen for interregional comparison is in the central Lau Islands and is designated in this paper as the "eastern" group. Lying as they do, at the eastern end of Fiji, they are closest to Tonga, the nearest Polynesian neighbors. Tongan contact with Fiji in prehistoric as well as more recent times is well established. [2] It is in the Lau Islands that Polynesian cultural affinities are most marked. Hence, it seems a logical choice for a second and separate glance in the racial history.
The third comparative sample might be termed an intermediate group. It is taken from the coastal villages of eastern Viti Levu, largely from the provinces of Rewa and Tailevu. This area is geographically between the "interior" and "eastern" groups and is referred to in this paper as the "coastal" group.
The final regional division represents the northwestern parts of Viti Levu. This is the place where, according to Fiji tradition, their [Pg 2] ancestors first landed after migrating from the west. [3] Fijian legend, which gives this hint of their ancestry, does not include a physical description of these immigrants. Nor does it define the physical appearance of the earlier people whom the newcomers encountered and with whom they mingled. On the rather slim hope that anthropometry might shed a little light on this questionable phase of Fijian history, this area, along with the first three, has received separate treatment.
THE HABITAT
The islands of Fiji are centrally located in the southwest Pacific. Over three hundred islands and islets make up the archipelago, which spreads between latitudes 15' and 22' south of the equator for 300 miles. The international date line runs through Fiji at the Koro Sea and the Moala Island group.
The total land area of the islands is about the equivalent of the state of Delaware, somewhat over 7,000 square miles. Two great islands account for nearly 95 per cent of the total area: Viti Levu, the largest, is over 4,000 square miles, and Vanua Levu, about half as large. Over 90 per cent of the native population lives on these two islands although nearly a hundred other islands are inhabited.
Most of the islands are made up of volcanic and sedimentary rocks. The largest islands rest on a submerged portion of an ancient land mass, sometimes called the Melanesian continent, which goes back in time to the Paleozoic and, in its prime, intermittently connected Fiji with southeastern Asia and Australia. Subsequent submergence, followed by cycles of volcanic upbuilding, erosion, and more submergence over eons of time, gave the big islands their upper foundations. The last extensive volcanic activity and land uplift occurred in the Pleistocene and accounts for many of the present mountain masses. The final touches to the Fiji profile have been wrought by more recent weathering and erosion. Sedimentation is still going on at river mouths and along the coasts, where deltas are being built and mangrove thickets flourish.
Many of the smaller islands are old limestone masses that were pushed up from the sea. Unlike the high craggy volcanic islands, these are lower and flat-topped. Typically, they contain a basin-shaped depressed area that is surrounded by a rim. These depressions are usually fertile and heavily forested.
Coral islands make up the third variety of land forms. These are always small and low. Their small size, thinner soil, and lack of fresh water make them much less suitable for human habitation. But even a thin layer of soil produces a luxurious vegetation.
Fringing and barrier reefs are abundant throughout the archipelago, surrounding nearly every island. The most striking of these formations is the Great Sea Reef, which forms an arc of nearly 300 miles along the western fringe of Fiji and encloses large areas of coral-infested sea.
Moderately high mountains give to the larger islands a generally rugged terrain. The more extensive ranges lie across the path of the prevailing south and easterly winds producing windward and leeward climatic areas. On the windward side rainfall is heavy and rather evenly distributed over the year. Here the valleys and mountain slopes support a typical dense tropical growth. The leeward side, however, receives much less moisture and has wet and dry seasons. Scattered patches of trees and grasses cover the ground, whereas heavy stands of forest are confined to valley bottoms and higher mountain slopes. The mountainous interior of Viti Levu contains a number of peaks over 3,000 feet, the highest of which is Mt. Victoria, 4,341 feet.
Surface water is abundant on the bigger islands. Several large and navigable rivers drain Viti Levu and Vanua Levu. The Rewa River, on the east side of Viti Levu is the largest and is navigable for small craft for 70 miles. Smaller rivers and hundreds of streams are important sources of food and drink for the people of the interior.
Great flood plains are formed at the mouths of the larger rivers. These and the fertile flats that run back along the valleys contain the greatest population densities.
The climate is generally pleasant and healthful. Tropical extremes of heat and humidity are moderated by the prevailing trades, which usually supply cool and pleasant breezes from the east. Still, days of uncomfortable heat and oppressive humidity are not unknown; however, such periods are protracted only in the interior. The climate is far from uniform throughout the islands. The windward sides, where rainfall often exceeds a hundred inches, have a more even temperature and sunshine is more moderate. On the leeward sides there is less general cloudiness and more sunshine, especially during the dry season. The smaller islands generally resemble the leeward areas in climate.
Native plant and animal life, like much of the southwest Pacific, is southeastern Asiatic in type and in origin. In the more profuse and varied windward sides there are several general vegetation zones. Along the coasts and in the larger river basins occur alluvial vegetation largely dominated by several kinds of mangrove, which is densest in mud flats washed by the tide. In this zone trees are scattered, and many of them bear useful nuts and fruits. On the slopes and ridges behind the coastal belts are the great tropical rain forests. They make up a dense cover of evergreen trees interwoven with wild creepers and vines. Thick stands of shrubs and smaller trees add to the tropical profusion. Above 2,000 feet the forests thin out and become more heavily coated with moss and lichens, and ferns and orchids attach themselves to the branches. Beyond 3,000 feet is the cloud belt, and above this trees become stunted and are finally replaced by hardy shrubs that cling to the rocks and crags.
On the leeward sides, patches of rain forest are found only in the moister areas. More typical of this zone are thin-leaved trees interspersed in large expanses of meadow and grassland.
A number of native plants are very vital to the Fijian livelihood and some have modern economic importance. Several timber trees are essential to house building, canoe construction, and wood carving. The ubiquitous palms, here as elsewhere in the Pacific, are vital sources of food, drink, building, and weaving materials and cordage. The mangrove provides firewood, house poles, fishing fences, and traps, laths for bows and black dye for their hair and tapa. Valuable starch is secured from the sago palm, which is cut just before flowering, and the leaves are a common thatching material. Various reeds, canes, and bamboos and lianas are useful to Fiji economy. In the drier areas reeds and grasses provide material for house walls, thatch, fish fences, and arrow shafts. Several kinds of trees yield edible nuts and fruits.
Like other central-Pacific island groups, Fiji is poorly provided with indigenous mammals. A small gray rat is a considerable pest in garden and homes, and a large nocturnal bat, which is called a flying fox, lives in tree colonies and is often seen at dusk in banana groves or other feeding places. All the economically important animals of Fiji have been introduced, such as pigs, fowl, dogs, cattle, horses, sheep, and goats.
Bird life is diverse and interesting, although in a number of places introduced forms, like mynahs and turtle doves, have forced the native varieties back into the jungle. Several game birds such as doves, pigeons, and ducks are occasionally hunted.
Snakes and lizards are fairly common on the islands; none is poisonous. Some are eaten, but the practice is not usual. Snakes had a more important place in the former religious and totemic practices.
Much more vital to the native economy is the abundant and varied marine life. This, with gardening, provides the foundation of Fijian subsistence. Turtles, crabs, prawns, eels, to say nothing of scores of fishes, are hunted, trapped, poisoned, speared, and netted. The cycle of the balolo worm has here the same importance as in other Pacific islands.
HISTORY
The first western contact with Fiji was made in 1643 when Captain Abel Tasman entered Fijian waters and sighted several islands and reefs without realizing the nature of his discovery. Over a hundred years later, Captain Cook made a second contact by stopping at one of the southern Lau Islands. Real knowledge of the area began in 1792 when Captain Bligh sailed through the archipelago from the southeast to the northwest, following the famous mutiny of the Bounty. Bligh made an attempt to land, was attacked by natives, and continued through the islands with no more landings. He did, however, make a record of most of the islands he passed.
In the nineteenth century, commercial contacts began in the form of sandalwood trade. This profitable commodity brought Europeans and Americans first to the Sandalwood Coast on the west side of Vanua Levu. During this period the first systematic survey of Fijian waters was made by the U.S. Exploring Expedition in 1840. After little more than a decade the sandalwood supply was depleted to the point where trade virtually ceased.
As a result of this initial commercial contact, which was mainly around western Vanua Levu and eastern Viti Levu, some marked changes were effected in Fijian culture. After the sandalwood traders abandoned Fiji for more profitable fields, a number of deserters and ship-wrecked men remained. These beachcombers, along with firearms that had been introduced by trade or salvaged from wrecks, brought about the first striking alterations. Rival chiefs competed for the acquisition of muskets, gunpowder, and beachcombers. The latter in some instances became attached to royal households as dubious advisors and instructors in the use of guns, powder, and shot. Some of these coaches enjoyed a status resembling that of household pets.
The introduction of firearms changed the native political scene and increased the scope and destructiveness of warfare. For a time the rulers of Mbau in eastern Viti nearly monopolized the supply of muskets and white men. This established their political supremacy over rival [Pg 3] leaders. Larger and stronger political and military alliances, some resembling small kingdoms, developed for purposes of defense or aggression. As warfare grew more frequent, new diseases entered the islands and trade in liquor advanced.
After the third decade of the nineteenth century better elements began to enter Fiji and ensuing culture contact was not so consistently deplorable. Bêche-de-mer traders and whalers began to visit the islands for trade goods and supplies. Some began to settle at the east end of Viti Levu. Missionaries came in the 1830's and the Christianization of Fiji began.
Internal conflict between rival chiefs, attacks on French, British, and American ships, with subsequent reprisals, continued and intensified. By mid-century, rivalry between the local kingdoms of Mbau and Rewa reached a peak. At this time the powerful ruler of Mbau, Thakombau, who dominated a large segment of eastern Viti Levu, had become hard pressed by his Rewa enemies. Thakombau submitted to the missionaries who had been pressing his conversion. With his support of the missionaries, the native struggles became a religious war between Christianity and paganism as well as between nativism and westernism. Thakombau's cause was rescued in 1855 when King George of Tonga brought an army of 2,000 warriors to Fiji and combined his strength with that of the kingdom of Mbau. Thenceforth Thakombau remained the paramount chief in eastern Fiji and for some twenty ensuing years ruled under the dominance of Tongan princes. Another Tongan chief, Ma'afu, arrived in 1848 and set up a political domain that rivaled the kingdom of Thakombau.
Throughout these struggles and particularly with the conversion of Thakombau and the leadership of the already Christianized Tongan chiefs, native religion, including cannibalism, rapidly declined. Meanwhile, English, Australian, and New Zealand settlers were augmenting earlier trade contacts. Plantations and trade centers developed, and in 1857 a British consul was appointed and set up at Levuka on the east coast of Viti Levu. A few years later Thakombau sought relief from the payment of indemnities to foreign powers and from internal harassments by an offer to cede his dominions to Great Britain. The initial offer was declined and the British consul was recalled in 1860.
The next ten years saw a continuation of political and military turmoil stemming from rival interests of native rulers, Tongan interlopers, and European immigrants. A second appeal to the British government resulted in an unconditional deed of cession on October 10, 1874, which marks the beginning of Fiji's status as a British Crown Colony.
POPULATION
Over 300,000 people live in the Fiji Islands. Of these about 140,000 are native Fijians. The others are arranged in the following divisions: [4]
| Indians | 154,803 | |
| Europeans | 6,500 | |
| Part European | 7,496 | |
| Polynesians Melanesians Micronesians |
} | 4,133 |
| Rotumans | 3,990 | |
| Chinese | 3,857 | |
| Others | 649 |
When Fiji became a British Crown Colony in 1874 the population was entirely native except for a handful of outsiders. At that time the population has been variously estimated at approximately 200,000. Shortly thereafter a measles epidemic reduced their number severely. This, with other epidemics and maladies for which they had little or no immunity or resistence, continued the decimation until by 1905 there were only 87,000. During the next decade they held their own, until in 1919 the influenza scourge brought them to their lowest level of 83,000. This was the last serious setback to their number; since that time the population has been on the upgrade.
A present threat to Fijian population, in the opinion of many, stems not from disease but from the Indian presence. This began in the latter part of the nineteenth century when Indian immigration of indentured laborers began. The influx went on until 1916 by which time some 40,000 to 50,000 Indians had come to Fiji and very few had returned to India. Since then, the Indians have increased more rapidly than the Fijians until they now outnumber them. This situation has, of course, created numerous problems beyond the scope of this paper.
It is significant to point out that intermarriage or interbreeding between Fijians and Indians is relatively slight. The amount of mingling of Fijians with Europeans or Orientals cannot be demonstrated statistically, but it has not been extensive. The Fijians, on the whole, retain pretty much of their prehistoric racial make-up.
RACIAL BACKGROUND
It is well established that the Fijians are a mixed people, derived mainly from Melanesian and Polynesian sources. Both of these parental strains in turn are commonly believed to be racial blends. Hooton describes the Melanesians as Oceanic Negroes whose composition includes Negrito, Australoid, "plus convex-nosed Mediterranean plus minor fractions of Malay and Polynesian."[5] Birdsell sees the same three strains in Melanesia which he believes contribute to the Australians, namely Negrito, Murrayan, and Carpentarian, plus a small amount of Mongoloid. He believes they differ from Australians in being "basically negritic in their genetic composition as a result of the rain forest environment."[6] Polynesians, however, are usually thought to be derived from Caucasoid, Mongoloid, and Negroid strains in which the Caucasoid component is more often the strongest.
The composite character of the Fijians has been variously explained as far as order and time of the contributing elements are concerned. One theory regards a Negroid stock as aboriginal to which a Polynesian strain was later added. An early explanation of this sort is that of Fornander who held that the ancestors of the modern Polynesians coming from southeastern Asia via Indonesia in the early centuries A.D. made a prolonged stopover in Fiji as they moved eastward. This left a Polynesian imprint on the native Fijian physical appearance as well as on their language and culture.[7] Later on, Churchill added a second movement of Polynesians from the west about a thousand years later. This was used to explain a certain amount of Mongoloid elements that needed accounting for in western Polynesia.[8]
A differing interpretation brings the Polynesian influence into Fiji from the east in relatively recent times. Thomson, for example, regards it as mainly Tongan. There are many references in the eighteenth and nineteenth centuries to Tongan presence in Fiji; they came to trade, to fight, and merely to visit.
Hocart believes the Polynesians at one time occupied most of Fiji until they were driven eastward to Tonga and Samoa by native Melanesians.[9] Howells tentatively suggests another possibility: originally all of Fiji was occupied by Polynesians except perhaps for some Melanesian tribes in the mountainous interior of Viti Levu. Around the eleventh century a wave of immigrants from the west reached Fiji. "The newcomers, taking possession of the archipelago, partly amalgamated with and partly pushed out the Polynesian tenants, just as did the hill tribes of Hocart's theory, the refugees fleeing to Somoa and Tonga."[10] Howells associates this immigration with the Fijian tradition of an arrival of ancestral families from across the western sea.
This Fijian tradition of their own origin includes a landing on the west coast of Viti Levu at Nandi by an ancestral chief and his sons who came across the sea from the west. Several of his sons moved eastward and eventually founded families with native wives in various parts of the archipelago. These families ultimately became consolidated into present-day tribes or federations. Most Fijian social units derive their origin from this or similar legendary immigrations. These eposodes occurred eight or ten and, in one case, fifteen generations ago.[11] Where these ancestors came from or what their racial affiliations were is not described in the stories. On the basis of supposed similarities of place-names, claims have been made for Africa as the place of origin, but the validity of them is dubious. It is likely that these traditions refer only to the more recent immigrations from the west. As to the racial make-up of the ancestors, it is commonly believed that they were Polynesians who, after settling in various parts of Fiji, took native wives, presumably Melanesian, and originated many of the existing family lines. This assumption does not rest on any actual physical reference to their appearance but on such cultural data as their patrilineal succession and their tradition of strong hereditary chieftainship.
ACKNOWLEDGMENTS
I am indebted to a number of people of Fiji whose assistance and coöperation were helpful. Thanks are due to Sir Ronald Garvey, governor of Fiji, whose approval of my project gave administrative sanction. Mr. G. Kingsley Roth, the Secretary for Fijian Affairs, secured for me the coöperation of the Fijian Affairs Department, which in turn gave me access to the proper native officers and leaders, furnished me with necessary transportation; he also gave me some sound advice. Also of the Fijian Affairs Office, Ratu Dr. Dobi helped me make the necessary contacts as my work took me from one area to another. Mr. Robbin H. Yarrow, safety officer of the Emperor Gold Mining Company, was most helpful during my stay at Vatukoula, where I secured an excellent sample of the northern provinces.
The young Fijian who acted as my interpreter, guide, and recorder was Joji Qalelawe; my especial thanks to him for his intelligent and cheerful coöperation.
MEASUREMENTS AND INDICES
GENERAL
Weight[12]
| No. | Range | Mean | S.D. | C.V. | |
| Total sample | 814 | 105-300 | 163.0 | 20.3 | 12.5 |
| Interior | 0 | 0 | 0 | 0 | 0 |
| East | 73 | 130-245 | 168.1 | 19.3 | 11.5 |
| Coast | 210 | 118-300 | 160.7 | 22.8 | 14.2 |
| N.W. | 79 | 120-212 | 161.9 | 16.9 | 10.4 |
The average weight of 163 pounds, coupled with their rather tall stature, describes the Fijian as a large person, on the whole. Their generous weight does not reflect excessive obesity; the body build, as will be pointed out later, is prevailingly muscular and athletic. Variation among the regional samples is not significant; all the groups average more than 160 pounds.
Stature
| No. | Range | Mean | S.D. | C.V. | |
| Total sample | 815 | 150.1-195.0 | 172.5 | 6.1 | 3.5 |
| Interior | 154 | 150.1-183.7 | 169.6 | 6.0 | 3.5 |
| East | 120 | 160.2-190.5 | 173.3 | 6.0 | 3.5 |
| Coast | 210 | 156.1-195.0 | 173.4 | 5.8 | 3.4 |
| N.W. | 79 | 159.8-186.0 | 172.7 | 5.8 | 3.3 |
| Fiji (Howells) | 133 | 158-190 | 170.8 | 6.1 | 3.6 |
| Solomons (Howells) | 85 | 146-181 | 160.2 | 6.8 | 4.2 |
| Tonga (Sullivan) | 92 | 160-188 | 173.0 | 5.2 | 3.0 |
The stature of the Fijians is moderately tall. Howells' series of Fijians, as well as mine, indicate this category. In this measurement, the Fijians are similar to the Tongans. They are 12 cm. taller than the Melanesians.
Among the Fijian themselves, the interior people of the highlands are definitely shorter than the rest of the population.
Rumors still persist of remnants of pygmoid people in the interior mountains of Viti Levu. I found no evidence of them either in my travels in the interior or by extensive inquiries among natives and Europeans who had thorough knowledge of the whole island.
Span
| No. | Range | Mean | S.D. | C.V. | |
| Total sample | 815 | 155.0-208.0 | 180.0 | 15.1 | 8.8 |
| Interior | 154 | 155.0-201.0 | 179.5 | 7.5 | 4.2 |
| East | 120 | 166.4-200.5 | 178.1 | 24.3 | 13.6 |
| Coast | 210 | 160.1-208.0 | 181.2 | 14.6 | 8.1 |
| N.W. | 79 | 165.1-202.0 | 180.0 | 21.6 | 11.9 |
Span of the arms also reflects the generous proportions of the Fijians. Regional difference is not marked. Relative to stature, the hill people have the longer arms and the eastern natives the shortest. The greater relative arm length of the hill tribes seems to be owing more to deficiency of stature than to excessive arm length or shoulder breadth.
Span-Stature Index
| No. | Range | Mean | S.D. | C.V. | |
| Total sample | 815 | 96.1-116.3 | 104.3 | 8.5 | 8.15 |
| Interior | 154 | 99.4-115.1 | 105.2 | 2.3 | 2.2 |
| East | 120 | 99.1-108.5 | 102.7 | 13.5 | 13.14 |
| Coast | 210 | 97.9-116.3 | 104.4 | 7.7 | 7.4 |
| N.W. | 79 | 100.2-109.7 | 104.1 | 12.0 | 11.5 |
THE TRUNK
Sitting Height
| No. | Range | Mean | S.D. | C.V. | |
| Total sample | 815 | 75.1-100 | 87.0 | 3.5 | 3.9 |
| Interior | 154 | 75.1-94 | 84.4 | 9.4 | 11.0 |
| East | 120 | 81-100 | 88.5 | 3.5 | 3.9 |
| Coast | 210 | 80-99 | 87.7 | 3.2 | 3.6 |
| N.W. | 79 | 80-94 | 86.0 | 2.9 | 3.3 |
| Fiji (Howells) | 132 | 78-101 | 88.3 | 3.06 | 3.46 |
| Solomons (Howells) | 85 | 69-95 | 83.6 | 3.8 | 4.5 |
A total sitting height average of 87 cm. attests the generous general body length. A regional trend follows the same curve as that for stature. The eastern body length is greatest; it exceeds the over-all average by 1-1/2 cm. and is more than 4 cm. larger than the interior people who fall at the bottom of the scale of sitting height. Howells' Fijian series is close to my eastern average. Compared with the Solomon Islands natives, the Fijians are much more elongated.
Relative Sitting Height
| No. | Range | Mean | S.D. | C.V. | |
| Total sample | 815 | 45-58 | 50.4 | 1.5 | 3.0 |
| Interior | 154 | 46-56 | 49.8 | 1.4 | 2.8 |
| East | 120 | 48-54 | 51.0 | 1.3 | 2.5 |
| Coast | 210 | 46-56 | 50.5 | 1.4 | 2.8 |
| N.W. | 79 | 47-54 | 50.2 | 1.4 | 2.8 |
| Fiji (Howells) | 132 | 46-57 | 51.7 | 1.36 | 2.63 |
| Solomons (Howells) | 85 | 46-57 | 52.1 | 1.64 | 2.92 |
The relative sitting height ratio for all Fijians is 50.4 per cent. The eastern average of 51 per cent indicates a little more legginess, whereas the interior groups tend somewhat to longer trunks.
Biacromial
| No. | Range | Mean | S.D. | C.V. | |
| Total sample | 815 | 28-47 | 39.7 | 8.2 | 6.2 |
| Interior | 154 | 29-43 | 39.0 | 6.2 | 4.7 |
| East | 120 | 35-45 | 39.9 | 6.1 | 4.0 |
| Coast | 210 | 28-45 | 39.7 | 7.6 | 4.9 |
| N.W. | 79 | 35-47 | 40.5 | 6.6 | 3.9 |
The Fijians are generally a broad-shouldered people. The inhabitants of Ra and Ba have the highest average and the interior people are least broad-shouldered.
Relative Shoulder Breadth
| No. | Range | Mean | S.D. | C.V. | |
| Total sample | 815 | 18-27 | 22.3 | 1.3 | 5.8 |
| Interior | 154 | 19-25 | 22.9 | 1.0 | 3.9 |
| East | 120 | 20-26 | 23.0 | 1.0 | 3.9 |
| Coast | 210 | 18-26 | 22.9 | 1.0 | 4.4 |
| N.W. | 79 | 20-27 | 23.4 | 3.1 | 13.2 |
Relative to total stature, shoulder breadth averages 22.3 per cent. No significant regional differences are indicated.
Bi-Iliac
| No. | Range | Mean | S.D. | C.V. | |
| Total sample | 815 | 23-40 | 29.2 | 5.6 | 5.3 |
| Interior | 154 | 25-38 | 29.0 | 5.1 | 5.2 |
| East | 120 | 27-34 | 29.5 | 4.1 | 4.8 |
| Coast | 210 | 23-37 | 29.2 | 5.9 | 5.5 |
| N.W. | 79 | 26-32 | 29.3 | 4.6 | 5.0 |
The Fijians, as a whole, are fairly broad-hipped; this condition holds with little variation in all the provinces.
Shoulder-Hip
| No. | Range | Mean | S.D. | C.V. | |
| Total sample | 815 | 58-101 | 73.7 | 4.3 | 5.8 |
| Interior | 154 | 65-100 | 74.6 | 4.2 | 5.6 |
| East | 120 | 67-82 | 73.8 | 3.2 | 4.3 |
| Coast | 210 | 58-99 | 73.5 | 4.3 | 5.9 |
| N.W. | 79 | 62-86 | 72.8 | 5.9 | 8.1 |
The total shoulder-hip ratio describes the shoulders as 73.7 per cent as wide as the hips. These ratios do not vary greatly in different parts of Fiji. The somewhat higher index of the hill groups is owing largely to their narrower shoulders, whereas the superior shoulder breadth of the northwest provinces contributes mostly to the lower hip-shoulder index.
Chest Breadth
| No. | Range | Mean | S.D. | C.V. | |
| Total sample | 815 | 24-39 | 28.6 | 6.4 | 5.7 |
| Interior | 154 | 25-33 | 28.6 | 3.3 | 4.7 |
| East | 120 | 26-39 | 29.4 | 7.2 | 5.8 |
| Coast | 210 | 25-37 | 28.7 | 7.8 | 6.2 |
| N.W. | 79 | 25-32 | 28.9 | 4.3 | 4.9 |
Broad chests are also characteristic in Fiji. The eastern men surpass the Viti Levu males, and the interior groups have the narrowest chests, but the regional variations are small.
Chest Depth
| No. | Range | Mean | S.D. | C.V. | |
| Total sample | 815 | 184-308 | 22.9 | 5.5 | 7.0 |
| Interior | 154 | 195-263 | 22.4 | 3.2 | 5.8 |
| East | 120 | 189-295 | 22.5 | 4.9 | 6.6 |
| Coast | 210 | 184-300 | 21.7 | 5.7 | 7.2 |
| N.W. | 79 | 192-250 | 21.8 | 3.3 | 6.0 |
The chests of the Fijians are also fairly deep. The close similarity in chest depth of the interior group and the eastern sample is rather striking inasmuch as the former are nearly 4 cm. shorter in stature. This would indicate that the interior group, for their size, are relatively deep-chested.
Thoracic
| No. | Range | Mean | S.D. | C.V. | |
| Total sample | 815 | 59-96 | 76.4 | 4.6 | 6.0 |
| Interior | 154 | 69-88 | 78.5 | 3.9 | 5.0 |
| East | 120 | 65-85 | 76.3 | 4.3 | 5.6 |
| Coast | 210 | 56-89 | 75.5 | 4.7 | 6.2 |
| N.W. | 79 | 65-85 | 75.7 | 4.4 | 5.8 |
The thoracic index shows that the Fijians are deep-chested relative to thoracic breadth as well as in absolute values. Again the interior people stand out for their deeper chests.
ARMS AND LEGS
Arm Length
| No. | Range | Mean | S.D. | C.V. | |
| Total sample | 815 | 45-87 | 75.2 | 5.0 | 6.6 |
| Interior | 154 | 45-83 | 73.6 | 4.8 | 6.1 |
| East | 120 | 52-84 | 75.1 | 3.9 | 5.2 |
| Coast | 210 | 57-87 | 76.0 | 4.9 | 6.4 |
| N.W. | 79 | 55-86 | 75.3 | 6.6 | 8.8 |
The over-all arm length is 75.2 cm. Shorter arms seem to be characteristic of the interior population where the average is nearly 2 cm. less than the over-all average. The eastern group has the longest arms; the other samples are intermediate.
Humeral Length
| No. | Range | Mean | S.D. | C.V. | |
| Total sample | 815 | 26-39 | 32.8 | 8.6 | 5.7 |
| Interior | 154 | 28-38 | 32.8 | 7.1 | 5.2 |
| East | 120 | 28-39 | 32.9 | 8.3 | 5.6 |
| Coast | 210 | 26-38 | 32.9 | 9.1 | 5.8 |
| N.W. | 79 | 28-38 | 33.0 | 7.9 | 5.4 |
Length of the upper arm averages 33 cm. for all Fijians; the several provinces are closely similar in this trait.
Radial Length
| No. | Range | Mean | S.D. | C.V. | |
| Total sample | 815 | 23-35 | 27.6 | 4.1 | 5.1 |
| Interior | 154 | 24-33 | 27.3 | 2.4 | 4.5 |
| East | 120 | 23-34 | 27.5 | 6.9 | 6.1 |
| Coast | 210 | 24-35 | 27.9 | 3.5 | 4.8 |
| N.W. | 79 | 25-32 | 27.9 | 3.4 | 4.8 |
Lower arm length is 27.6 cm. and also varies but little among the regional samples.
Radial-Humeral
| No. | Range | Mean | S.D. | C.V. | |
| Total sample | 815 | 65-113 | 84.0 | 4.2 | 5.0 |
| Interior | 154 | 77-104 | 83.0 | 3.8 | 4.6 |
| East | 120 | 65-95 | 83.5 | 4.7 | 5.6 |
| Coast | 210 | 75-113 | 84.7 | 4.2 | 4.9 |
| N.W. | 79 | 77-94 | 82.2 | 3.6 | 4.3 |
The radial-humeral ratio indicates that the lower arm of Fijians is 84 per cent as long as the upper arm. None of the subgroups deviates markedly from this average.
Leg Length[13]
| No. | Range | Mean | S.D. | C.V. | |
| Total sample | 815 | 61-98 | 84.3 | 10.5 | 12.5 |
| Interior | 154 | 74-96 | 81.1 | 8.6 | 12.9 |
| East | 120 | 73-96 | 84.1 | 8.6 | 10.3 |
| Coast | 210 | 68-97 | 85.3 | 7.2 | 8.5 |
| N.W. | 79 | 75-95 | 85.7 | 4.4 | 5.2 |
Average leg length is 84.3 cm., and some regional differences are manifest. The legs of the hill people are shorter by 3 cm. than are the other groups. Their neighbors to the northwest and east have the longest legs, and the eastern are intermediate.
Tibial Length
| No. | Range | Mean | S.D. | C.V. | |
| Total sample | 815 | 34-49 | 40.9 | 8.3 | 6.9 |
| Interior | 154 | 35-45 | 40.3 | 13.4 | 10.8 |
| East | 120 | 35-47 | 40.7 | 6.2 | 5.2 |
| Coast | 210 | 35-47 | 41.2 | 6.8 | 5.1 |
| N.W. | 79 | 36-47 | 40.9 | 6.1 | 5.9 |
Lower leg length is around 40 cm. for all Fijians. The regional pattern is similar to that of total leg length: shortest in the highlands, intermediate in the east, and longest in the coastal and northwestern districts.
Calf Circumference
| No. | Range | Mean | S.D. | C.V. | |
| Total sample | 815 | 29-57 | 37.6 | 6.7 | 7.1 |
| Interior | 154 | 31-51 | 37.0 | 6.4 | 7.1 |
| East | 120 | 33-50 | 38.1 | 4.7 | 6.5 |
| Coast | 210 | 29-48 | 37.2 | 9.4 | 7.9 |
| N.W. | 79 | 30-43 | 37.7 | 7.6 | 6.3 |
The generous girth of the calf of the Fijians reflects their sturdily muscled legs. The eastern groups excel the other Fijians in this respect, whereas the interior groups have the lowest average for calf circumference.
THE HEAD
Head Circumference
| No. | Range | Mean | S.D. | C.V. | |
| Total sample | 815 | 410-630 | 562.4 | 7.8 | 6.7 |
| Interior | 154 | 537-613 | 565.3 | 4.1 | 2.5 |
| East | 120 | 528-630 | 566.3 | 4.9 | 2.9 |
| Coast | 210 | 410-630 | 563.5 | 4.6 | 3.5 |
| N.W. | 79 | 537-597 | 557.7 | 14.3 | 11.5 |
The head circumference average of 562.4 mm. Probably is a little on the large size because of the thick wiry hair of most Fijians; the eastern groups appear to have the largest heads and the northwestern groups show a rather abrupt drop.
Head Length[14]
| No. | Range | Mean | S.D. | C.V. | |
| Total sample | 815 | 162-215 | 187.9 | 9.4 | 5.0 |
| Interior | 154 | 170-210 | 190.1 | 7.6 | 4.0 |
| East | 120 | 172-209 | 188.6 | 6.6 | 3.5 |
| Coast | 210 | 162-215 | 187.4 | 13.5 | 7.2 |
| N.W. | 79 | 165-214 | 187.2 | 7.9 | 4.2 |
| Fiji (Howells) | 133 | 164-208 | 188.8 | 7.29 | 3.86 |
| Solomons (Howells) | 85 | 170-208 | 188.5 | 6.5 | 3.5 |
| Tonga (Sullivan) | 117 | 173-213 | 191.0 | 6.6 | 3.5 |
Total head length for all Fijians is 187.9 mm; longest heads occur in the interior. Both Howells' Fijian average and the Solomon Islands series are close to the above value. Gifford's Tongan head length of 191 mm. Somewhat exceeds the Fijian.
Head Breadth
| No. | Range | Mean | S.D. | C.V. | |
| Total sample | 815 | 122-186 | 155.9 | 6.8 | 7.7 |
| Interior | 154 | 135-170 | 152.1 | 6.6 | 4.3 |
| East | 120 | 144-172 | 157.2 | 5.2 | 3.3 |
| Coast | 210 | 141-186 | 158.3 | 9.3 | 8.5 |
| N.W. | 79 | 122-185 | 152.9 | 8.6 | 8.2 |
| Fiji (Howells) | 133 | 135-170 | 153.7 | 6.1 | 3.9 |
| Solomons (Howells) | 85 | 126-158 | 144.7 | 5.2 | 3.6 |
| Tonga (Sullivan) | 117 | 145-167 | 154.8 | 4.3 | 2.8 |
General head breadth is 155.9 mm., and considerable regional variation is shown. Fijians of the interior have the narrowest heads, whereas the coastal and eastern people have appreciably wider heads. Howells' series of Fijians are closest to my highland groups.
The Solomon Islanders are markedly narrower headed than the Fijians, whereas Sullivan's Tongan series is nearer the Fijian average.
Cephalic Index
| No. | Range | Mean | S.D. | C.V. | |
| Total sample | 815 | 68-99 | 83.0 | 6.4 | 7.7 |
| Interior | 154 | 68-96 | 80.0 | 6.0 | 7.3 |
| East | 120 | 72-92 | 83.9 | 3.8 | 4.5 |
| Coast | 210 | 72-99 | 84.2 | 7.2 | 8.6 |
| N.W. | 79 | 71-95 | 81.6 | 10.3 | 12.6 |
| Fiji (Howells) | 133 | 68-94 | 81.54 | 4.7 | 5.7 |
| Solomons (Howells) | 85 | 65-88 | 76.8 | 3.9 | 5.1 |
| Tonga (Sullivan) | 117 | 73-89 | 81.1 | 3.1 | 3.9 |
Most Fijians tend to brachycephaly. The eastern natives and those of the coastal series have the broadest heads. The interior people show definitely lesser values in this ratio than do the other groups. Howells' Fijian series is close to the northwestern Fijians in their mesocephaly, and so is the Tongan mean. The Solomon series borders on dolicocephaly.
Head Height
| No. | Range | Mean | S.D. | C.V. | |
| Total sample | 815 | 110-154 | 129.5 | 6.8 | 7.9 |
| Interior | 154 | 114-140 | 127.7 | 4.8 | 3.8 |
| East | 120 | 114-148 | 129.6 | 5.0 | 3.9 |
| Coast | 210 | 112-154 | 120.0 | 7.0 | 5.4 |
| N.W. | 79 | 117-142 | 127.6 | 9.2 | 8.9 |
Head height averages do not differ greatly among the provinces. The interior and northwestern people have somewhat lower heads; the coastal and eastern people show slight superiority.
Length-Height
| No. | Range | Mean | S.D. | C.V. | |
| Total sample | 815 | 55-84 | 69.0 | 3.4 | 3.6 |
| Interior | 154 | 59-77 | 67.2 | 3.9 | 5.8 |
| East | 120 | 61-78 | 68.7 | 3.2 | 4.7 |
| Coast | 210 | 55-84 | 69.4 | 3.7 | 4.3 |
| N.W. | 79 | 58-84 | 68.1 | 4.5 | 3.5 |
Relative to head length, the cranial vault of Fijians is high. The mountain people show the lowest relative head height, whereas the other provinces are nearer to the over-all average.
Breadth-Height
| No. | Range | Mean | S.D. | C.V. | |
| Total sample | 815 | 66-102 | 83.0 | 3.0 | 3.3 |
| Interior | 154 | 75- 96 | 84.0 | 3.9 | 4.6 |
| East | 120 | 75- 91 | 82.4 | 3.4 | 4.1 |
| Coast | 210 | 66- 97 | 82.8 | 5.3 | 8.4 |
| N.W. | 79 | 73- 92 | 81.2 | 8.6 | 9.7 |
Head height relative to total breadth is 83 per cent. In this ratio the interior groups have the highest index, a condition owing more to deficiency in cranial breadth than to superior head height.
Cranial Module
| No. | Range | Mean | S.D. | C.V. | |
| Total sample | 815 | 141-176 | 157.7 | 10.5 | 6.7 |
| Interior | 154 | 147-166 | 156.6 | 11.5 | 7.3 |
| East | 120 | 148-172 | 158.4 | 4.4 | 2.7 |
| Coast | 210 | 143-176 | 158.5 | 15.5 | 9.7 |
| N.W. | 79 | 141-171 | 155.9 | 10.7 | 6.7 |
Head size as expressed by the cranial module averages 157.7 mm. for all Fijians. Regional fluctuation is unimportant.
Minimum Frontal
| No. | Range | Mean | S.D. | C.V. | |
| Total sample | 815 | 99-125 | 109.9 | 4.0 | 2.7 |
| Interior | 154 | 100-121 | 109.8 | 3.6 | 3.3 |
| East | 120 | 99-122 | 110.8 | 3.8 | 3.4 |
| Coast | 210 | 100-125 | 109.7 | 4.7 | 4.3 |
| N.W. | 79 | 101-120 | 109.4 | 3.7 | 3.4 |
A minimum frontal diameter of 109.9 mm. indicates a fairly ample forehead breadth for the total sample. None of the subgroups depart much from this value.
Fronto-Parietal
| No. | Range | Mean | S.D. | C.V. | |
| Total sample | 815 | 58-89 | 70.6 | 4.3 | 6.1 |
| Interior | 154 | 63-82 | 72.2 | 3.3 | 4.6 |
| East | 120 | 64-79 | 70.5 | 3.0 | 4.3 |
| Coast | 210 | 58-77 | 69.9 | 4.1 | 5.9 |
| N.W. | 79 | 61-89 | 69.7 | 8.7 | 12.5 |
Forehead breadth relative to total cranial width is 70.6 per cent. The greatest deviation from this average occurs in the interior where the fronto-parietal ratio is 72.2 per cent and lesser head breadth more than greater forehead width causes the higher index.
THE FACE
Bizygomatic
| No. | Range | Mean | S.D. | C.V. | |
| Total sample | 815 | 110-164 | 145.7 | 5.0 | 3.4 |
| Interior | 154 | 110-163 | 145.8 | 6.3 | 4.3 |
| East | 120 | 137-161 | 146.7 | 4.3 | 2.9 |
| Coast | 210 | 128-164 | 145.2 | 4.9 | 3.4 |
| N.W. | 79 | 136-156 | 145.1 | 4.3 | 3.0 |
| Fiji (Howells) | 132 | 130-159 | 144.05 | 5.05 | 3.5 |
| Solomons (Howells) | 84 | 115-149 | 138.0 | 5.5 | 4.0 |
| Tonga (Sullivan) | 116 | 131-159 | 143.5 | 5.9 | 4.1 |
Broad faces are the rule among most of these people, as the total average of 145.7 mm. shows. Regional values for this criterion are closely alike in all parts of Fiji, the eastern showing a slight superiority in bizygomatic breadth.
Howells' Fiji series is slightly lower in this diameter as is the Tongan average. The Solomon Islands natives have definitely narrower faces.
Cephalo-Facial
| No. | Range | Mean | S.D. | C.V. | |
| Total sample | 815 | 82-108 | 93.5 | 5.7 | 6.1 |
| Interior | 154 | 84-108 | 96.0 | 4.8 | 5.0 |
| East | 120 | 82-102 | 93.3 | 3.2 | 3.4 |
| Coast | 210 | 85-103 | 92.5 | 5.7 | 6.2 |
| N.W. | 79 | 80-104 | 92.6 | 6.4 | 7.3 |
| Fiji (Howells) | 132 | 85-111 | 93.7 | 3.5 | 3.7 |
| Solomons (Howells) | 84 | 85-111 | 95.4 | 3.8 | 4.0 |
| Tonga (Sullivan) | 116 | 85-103 | 92.8 | 3.5 | 3.7 |
Face breadth relative to head width averages 93.5 per cent for all Fijians; Howell's series is much the same. The narrower heads of the interior people largely account for their higher index; otherwise there is general similarity in the several provinces.
Zygo-Frontal
| No. | Range | Mean | S.D. | C.V. | |
| Total sample | 815 | 64-100 | 75.5 | 3.0 | 3.9 |
| Interior | 154 | 64-98 | 75.4 | 3.2 | 4.2 |
| East | 120 | 68-99 | 75.5 | 2.5 | 3.3 |
| Coast | 210 | 66-100 | 75.5 | 3.1 | 4.1 |
| N.W. | 79 | 66-93 | 75.4 | 2.9 | 3.8 |
| Tonga (Sullivan) | 116 | 63-84 | 73.1 | 4.2 | 5.8 |
The ratio of forehead width to face breadth is 75.5. All of the regional averages for the zygo-frontal index are strikingly alike among the Fijians in every instance; the forehead is about three-quarters the breadth of the face. The Tongan ratio is a little lower.
Total Face Height
| No. | Range | Mean | S.D. | C.V. | |
| Total sample | 815 | 100-147 | 122.5 | 6.0 | 4.9 |
| Interior | 154 | 103-137 | 121.3 | 5.6 | 4.6 |
| East | 120 | 110-147 | 124.7 | 5.8 | 4.7 |
| Coast | 210 | 107-142 | 122.6 | 6.1 | 5.0 |
| N.W. | 79 | 100-143 | 121.7 | 6.8 | 5.6 |
| Fiji (Howells) | 133 | 105-159 | 121.8 | 6.9 | 5.7 |
| Solomons (Howells) | 85 | 100-129 | 116.4 | 6.6 | 5.7 |
| Tonga (Sullivan) | 116 | 112-147 | 128.2 | 6.8 | 5.3 |
Fijian faces have the moderate average height of 122.5 mm. Slightly shorter faces occur in the interior people, whereas the greatest total face height average occurs in the east. The Fijian of Howells' series is close to mine. The Tongan value for face height describes them as definitely longer faced. The Solomon Islanders depart in the other direction with decidedly shorter faces.
Total Facial Index
| No. | Range | Mean | S.D. | C.V. | |
| Total sample | 815 | 68-104 | 84.1 | 4.6 | 5.5 |
| Interior | 154 | 73-96 | 83.2 | 4.4 | 5.3 |
| East | 120 | 75-101 | 85.0 | 4.4 | 5.2 |
| Coast | 210 | 73-97 | 84.5 | 4.6 | 5.4 |
| N.W. | 79 | 68-104 | 83.9 | 5.6 | 6.7 |
| Fiji (Howells) | 132 | 74-105 | 84.7 | 5.0 | 6.0 |
| Solomons (Howells) | 84 | 74-97 | 84.5 | 4.4 | 5.2 |
| Tonga (Sullivan) | 116 | 78-102 | 89.3 | 4.4 | 5.0 |
Relative to maximum breadth, the Fijian face tends to shortness, although this is due largely to their generous facial breadth rather than absolute deficiency of height. The interior groups have the lowest values and the eastern groups show relatively broad faces.
The Tongan average is much higher than any of the Fijian values, whereas the Solomon Islanders show similarity to the Fijians in this feature.
Upper Face Height
| No. | Range | Mean | S.D. | C.V. | |
| Total sample | 815 | 56-84 | 70.2 | 5.1 | 7.3 |
| Interior | 154 | 59-79 | 69.1 | 3.9 | 5.6 |
| East | 120 | 64-83 | 71.7 | 4.0 | 5.6 |
| Coast | 210 | 59-84 | 70.4 | 6.6 | 9.4 |
| N.W. | 79 | 58-80 | 69.4 | 4.8 | 6.9 |
The ratio of the upper face height to maximum facial breadth shows the Fijians of the interior to be relatively shorter faced and the eastern people longest. The coastal and northwestern series are intermediate.
Upper Facial Index
| No. | Range | Mean | S.D. | C.V. | |
| Total sample | 815 | 37-65 | 48.2 | 3.7 | 7.7 |
| Interior | 154 | 41-65 | 47.4 | 3.3 | 7.0 |
| East | 120 | 42-59 | 48.9 | 2.9 | 5.9 |
| Coast | 210 | 40-59 | 48.5 | 4.8 | 9.9 |
| N.W. | 79 | 39-56 | 47.8 | 3.5 | 7.3 |
The ratio of the upper face height to maximum facial breadth shows the Fijians of the interior to be relatively shorter faced and the eastern people longest. The coastal and northwestern series are intermediate.
Bigonial
| No. | Range | Mean | S.D. | C.V. | |
| Total sample | 815 | 95-146 | 109.7 | 5.1 | 4.6 |
| Interior | 154 | 95-146 | 109.8 | 6.0 | 3.6 |
| East | 120 | 97-125 | 110.6 | 5.1 | 4.6 |
| Coast | 210 | 95-129 | 109.9 | 5.3 | 4.8 |
| N.W. | 79 | 99-119 | 109.1 | 4.5 | 4.1 |
| Tonga (Sullivan) | 116 | 92-119 | 104.8 | 5.8 | 5.5 |
Lower jaw breadth as expressed by the bigonial diameter indicates a tendency to broadness shared with little variation among all the subgroups. The Tongan value is considerably smaller.
Fronto-Gonial
| No. | Range | Mean | S.D. | C.V. | |
| Total sample | 815 | 80-122 | 99.9 | 5.5 | 5.5 |
| Interior | 154 | 84-122 | 100.0 | 6.0 | 6.0 |
| East | 120 | 86-115 | 99.9 | 5.3 | 5.3 |
| Coast | 210 | 80-114 | 100.3 | 6.0 | 6.0 |
| N.W. | 79 | 85-113 | 99.8 | 4.8 | 4.8 |
Similarly the bigonial diameter in relation to forehead breadth is much the same in all groups, the general average nearly 100 per cent.
Zygo-Gonial
| No. | Range | Mean | S.D. | C.V. | |
| Total sample | 815 | 65-86 | 75.3 | 4.1 | 5.4 |
| Interior | 154 | 67-86 | 75.4 | 6.0 | 8.0 |
| East | 120 | 65-82 | 75.4 | 3.5 | 4.6 |
| Coast | 210 | 66-83 | 75.7 | 3.4 | 4.5 |
| N.W. | 79 | 68-83 | 75.2 | 3.4 | 4.5 |
| Tonga (Sullivan) | 116 | 63-87 | 73.2 | 4.6 | 6.2 |
Relative to face breadth, jaw width is 75.3 per cent with very little geographic variation.
Nasal Height
| No. | Range | Mean | S.D. | C.V. | |
| Total sample | 815 | 42-65 | 53.9 | 3.4 | 6.3 |
| Interior | 154 | 45-65 | 53.2 | 3.5 | 6.6 |
| East | 120 | 48-62 | 54.7 | 3.1 | 5.7 |
| Coast | 210 | 46-63 | 54.1 | 3.4 | 6.3 |
| N.W. | 79 | 45-61 | 52.9 | 3.5 | 6.6 |
| Fiji (Howells) | 133 | 44-63 | 52.4 | 3.9 | 7.4 |
| Solomons (Howells) | 85 | 40-59 | 49.9 | 3.8 | 7.7 |
| Tonga (Sullivan) | 117 | 47-65 | 57.4 | 3.9 | 6.8 |
The Fijian nose may be called medium long. Greatest nasal heights occur in the eastern and in the coastal series. The interior and northwestern groups have shorter noses. The Fijians of Howells' series fall near the short end of my averages. Natives of the Solomons are definitely lower in nasal height, whereas the Tongan's average is so much higher that one suspects a difference in the location of the nasion.
Nasal Breadth
| No. | Range | Mean | S.D. | C.V. | |
| Total sample | 815 | 31-62 | 46.7 | 3.4 | 7.3 |
| Interior | 154 | 40-61 | 47.6 | 3.4 | 7.1 |
| East | 120 | 38-53 | 45.5 | 3.0 | 6.6 |
| Coast | 210 | 38-62 | 46.4 | 3.3 | 7.1 |
| N.W. | 79 | 31-57 | 47.4 | 3.6 | 7.6 |
| Fiji (Howells) | 133 | 37-54 | 46.19 | 3.0 | 6.0 |
| Solomons (Howells) | 85 | 34-51 | 44.6 | 2.8 | 6.3 |
| Tonga (Sullivan) | 117 | 38-55 | 44.4 | 3.0 | 6.8 |
Broad noses are common to most Fijians. The greatest contrast is between the narrower-nosed eastern people and the interior people, among whom the widest noses occur. The nose of the Solomon Islanders is somewhat narrower, according to Howells' data, and the Tongan average is also lower.
Nasal Index
| No. | Range | Mean | S.D. | C.V. | |
| Total sample | 815 | 61-112 | 87.1 | 8.2 | 9.4 |
| Interior | 154 | 69-109 | 89.7 | 8.1 | 9.0 |
| East | 120 | 61-100 | 83.2 | 7.6 | 9.1 |
| Coast | 210 | 63-111 | 86.0 | 7.1 | 8.7 |
| N.W. | 79 | 63-110 | 89.9 | 8.6 | 9.6 |
| Fiji (Howells) | 133 | 68-123 | 88.8 | 8.3 | 9.3 |
| Solomons (Howells) | 85 | 68-119 | 87.1 | 8.9 | 10.2 |
| Tonga (Sullivan) | 117 | 61-98 | 77.6 | 7.6 | 9.8 |
Platyrrhini is the rule in Fiji, but individual and regional variations are great. There are some leptorrine subjects in every province, and there are some whose noses are broader than long. The interior people and the northwestern groups have the relatively broadest noses, whereas the eastern index is more moderate. The noses of Sullivan's Tongans are relatively longer than the Lauans. The Solomon Island average is identical with the Fijian.
Nasal Depth
| No. | Range | Mean | S.D. | C.V. | |
| Total sample | 815 | 16-32 | 22.0 | 2.9 | 3.2 |
| Interior | 154 | 17-32 | 22.5 | 2.1 | 9.3 |
| East | 120 | 17-28 | 21.9 | 1.8 | 8.2 |
| Coast | 210 | 17-32 | 21.8 | 3.6 | 6.5 |
| N.W. | 79 | 16-29 | 22.3 | 1.9 | 8.5 |
Nasal depth averages 22 mm.; the regional variation is very small.
Nasal-Depth Index
| No. | Range | Mean | S.D. | C.V. | |
| Total sample | 815 | 32-60 | 47.2 | 6.8 | 6.8 |
| Interior | 154 | 34-59 | 47.4 | 5.1 | 6.6 |
| East | 120 | 35-60 | 48.4 | 4.6 | 9.5 |
| Coast | 210 | 32-58 | 47.0 | 8.1 | 7.2 |
| N.W. | 79 | 34-58 | 47.2 | 5.5 | 6.7 |
Mouth Breadth
| No. | Range | Mean | S.D. | C.V. | |
| Total sample | 815 | 29-72 | 57.6 | 4.7 | 8.2 |
| Interior | 154 | 34-72 | 59.6 | 4.4 | 7.4 |
| East | 120 | 33-66 | 56.5 | 3.9 | 6.9 |
| Coast | 210 | 29-67 | 57.3 | 4.0 | 7.0 |
| N.W. | 79 | 36-65 | 57.3 | 4.4 | 7.8 |
Mouth breadth averages show the interior groups to have widest mouths, the eastern people least wide, and the coastal and northwestern people intermediate.
Lip Thickness
| No. | Range | Mean | S.D. | C.V. | |
| Total sample | 815 | 9-45 | 22.4 | 3.8 | 6.9 |
| Interior | 154 | 12-31 | 23.4 | 3.6 | 5.4 |
| East | 120 | 12-29 | 21.7 | 3.4 | 5.7 |
| Coast | 210 | 16-45 | 20.8 | 3.6 | 5.3 |
| N.W. | 79 | 10-29 | 22.0 | 3.9 | 5.7 |
Thick lips are characteristic of most Fijians. The interior average is highest for this diameter, whereas the northwestern Fijians have least-thick lips.
Ear Length
| No. | Range | Mean | S.D. | C.V. | |
| Total sample | 815 | 55-83 | 66.6 | 4.5 | 6.8 |
| Interior | 154 | 53-83 | 66.0 | 4.8 | 7.3 |
| East | 120 | 55-80 | 67.2 | 5.0 | 7.4 |
| Coast | 210 | 55-77 | 66.7 | 4.9 | 7.3 |
| N.W. | 79 | 57-75 | 66.5 | 3.7 | 5.6 |
| Tonga (Sullivan) | 117 | 56-81 | 66.0 | 4.6 | 6.9 |
Fijian ears on the whole tend to be long, as the average 66.6 mm. indicates. Regional differences are slight. Tongans closely resemble Fijians.
Ear Breadth
| No. | Range | Mean | S.D. | C.V. | |
| Total sample | 815 | 24-55 | 34.3 | 3.2 | 9.3 |
| Interior | 154 | 27-41 | 33.7 | 2.5 | 7.4 |
| East | 120 | 29-40 | 34.1 | 4.0 | 11.7 |
| Coast | 210 | 29-55 | 34.7 | 3.9 | 11.2 |
| N.W. | 79 | 25-42 | 33.8 | 2.9 | 8.6 |
| Tonga (Sullivan) | 116 | 25-42 | 34.5 | 2.6 | 7.6 |
Ear breadth is also generous, and regional differences hardly exceed 1.5 mm., including the Tongans.
Ear Index
| No. | Range | Mean | S.D. | C.V. | |
| Total sample | 815 | 38-62 | 51.6 | 5.0 | 9.7 |
| Interior | 154 | 40-61 | 51.1 | 3.6 | 7.0 |
| East | 120 | 41-59 | 50.6 | 5.8 | 11.5 |
| Coast | 210 | 42-62 | 52.1 | 6.7 | 12.9 |
| N.W. | 79 | 38-59 | 50.9 | 4.0 | 7.9 |
| Tonga (Sullivan) | 116 | 41-62 | 52.4 | 3.9 | 7.5 |
Length-breadth ear ratios indicate that coastal groups have somewhat broader, and the northwestern people the relative longest, ears.
Bicanine Breadth
| No. | Range | Mean | S.D. | C.V. | |
| Total sample | 815 | 24-72 | 39.8 | 11.7 | 19.4 |
| Interior | 154 | 37-49 | 39.9 | 10.7 | 16.8 |
| East | 120 | 36-68 | 41.8 | 7.4 | 7.7 |
| Coast | 210 | 24-72 | 39.0 | 13.4 | 14.3 |
| N.W. | 79 | 38-49 | 38.6 | 14.0 | 16.3 |
Bicanine breadth is characteristically great among Fijians, reflecting the ample jaws and teeth. Widest diameters are seen in the east, followed by the hill people of the interior. The northwestern groups have the least bicanine diameter.
MORPHOLOGICAL OBSERVATIONS
PIGMENTATION
Skin Color: Exposed
| Brunet | Swarthy | Lt. Brn | Med. Brn | Dk. Brn | Black | Total | ||
| No. % | No. % | No. % | No. % | No. % | No. % | |||
| Total sample | 1 .01 | 5 .6 | 30 4 | 400 48 | 377 46 | 0 0 | 813 | |
| Interior | 0 0 | 0 0 | 1 1 | 55 36 | 97 63 | 0 0 | 153 | |
| East | 0 0 | 3 2 | 12 10 | 99 83 | 6 6 | 0 0 | 120 | |
| Coast | 0 0 | 1 0 | 7 3 | 85 41 | 116 56 | 0 0 | 209 | |
| N.W. | 0 0 | 0 0 | 1 1 | 42 53 | 36 46 | 0 0 | 79 | |
| Fiji II | 0 0 | 0 0 | 0 0 | 128 96 | 5 4 | 0 0 | 133 | |
| Solomons | 0 0 | 0 0 | 0 0 | 4 5 | 79 93 | 2 3 | 85 | |
| Tonga | (Range: Lt. Brown to Dk. Brown.) | |||||||
Color of skin includes exposed and unexposed areas. The former was observed on the face, since the Fijians do not use any kind of face or head covering. This condition in the total series divides itself quite evenly between medium brown and dark brown. A few have light-brown skin; only six individuals are classified as swarthy and brunet. None was judged to be completely black. The Fijians of Howells' series are described as 96 per cent medium brown[15] and 5 per cent dark brown, a discrepancy I would attribute to personal judgment difference. The Solomon Islanders are markedly darker than the Fijians, the majority have dark-brown skin and 3 per cent are black, whereas 5 per cent have medium-brown complexions.
Tongan data on skin color cannot be directly adjusted to my statistics. Sullivan's comment on their skin color states that it is "a medium yellowish-brown where it is unexposed to the sun. Exposed parts of the skin of a few of the persons were a very dark chocolate" (Sullivan, 1922, p. 248).
Among the Fijians themselves, the greatest contrasts occur between the eastern and the interior groups of Viti Levu. Where 63 per cent of the latter have dark-brown skin, only 5 per cent of eastern fall into this category. The bulk of eastern (83 per cent) have medium-brown skin as against 36 per cent of hill people. The coastal and northwestern provinces are, like the total series, more evenly divided between medium and dark brown.
Skin Color: Unexposed
| Brunet | Swarthy | Lt. Brn | Med. Brn | Dk. Brn | Black | Total | |
| No. % | No. % | No.% | No.% | No. % | No. % | ||
| Total sample | 6 1 | 9 1 | 242 30 | 545 66 | 11 1 | 0 0 | 813 |
| Interior | 0 0 | 0 0 | 20 13 | 133 87 | 0 0 | 0 0 | 153 |
| East | 3 3 | 4 3 | 77 64 | 36 30 | 0 0 | 0 0 | 120 |
| Coast | 1 1 | 2 1 | 56 27 | 148 71 | 2 1 | 0 0 | 209 |
| N.W. | 0 0 | 1 1 | 20 25 | 57 72 | 1 1 | 0 0 | 79 |
| Fiji II | 0 0 | 0 0 | 0 0 | 127 96 | 5 4 | 0 0 | 132 |
| Solomons | 0 0 | 0 0 | 0 0 | 9 11 | 74 87 | 2 2 | 85 |
Unexposed skin color was observed on the under surface of the upper arm near the armpit. The anticipated shift in color range results in a reduction of dark-skin incidence to a mere 1 per cent, and an increase in medium brown to 60 per cent and of light brown to 30 per cent.
Howells' describes 96 per cent of his Fijians as medium brown, 4 per cent dark brown, and none light brown. The Solomon Islanders seem definitely darker than the Fijians whether they are compared with Howells' or my series.
The eastern groups continues to contrast with the interior people. The former show a majority of 64 per cent in the light-brown category as compared with 13 per cent among the interior groups; the latter have a medium-brown incidence of 87 per cent against 30 per cent among Lauans.
Hair Color
| Black | Dk. Brn | Med. Brn | Lt. Brn | Red-Brn | Total | |
| No. % | No. % | No. % | No. % | No. % | ||
| Total sample | 757 93 | 31 5 | 1 0 | 0 0 | 18 2 | 807 |
| Interior | 145 95 | 8 5 | 0 0 | 0 0 | 0 0 | 153 |
| East | 114 95 | 6 5 | 0 0 | 0 0 | 0 0 | 120 |
| Coast | 193 92 | 11 5 | 0 0 | 0 0 | 5 2 | 204 |
| N.W. | 70 89 | 5 6 | 0 0 | 0 0 | 4 5 | 75 |
| Fiji II | 118 91 | 9 7 | 0 0 | 0 0 | 3 2 | 130 |
| Solomons | 55 65 | 26 31 | 0 0 | 3 4 | 0 0 | 84 |
| Tonga | 0 94 | 0 4 | 0 0 | 0 0 | 0 0 | 0 |
Black hair is the usual color, although 5 per cent are described as dark brown and a few red-brown. This latter variation is a rufous color (reddish-brown) and it may be a little more frequent than the data indicate because the Fijians frequently dye their hair with a substance extracted from mangrove bark. This intensifies the usual blackness of the hair and adds a satisfying gloss. More sophisticated natives have access to modern hair dye and lacking this, some have been known to resort to black shoe polish.
Hair bleaching is no longer practiced in Fiji.
The hair of the Solomons Islands is not so uniformly black, nearly a third have dark-brown hair and a few are light brown.
Eye Color
| Black | Dk. Brn | Med. Brn | Lt. Brn | Total | |
| No. % | No.% | No. % | No. % | ||
| Fiji I | 2 0 | 550 68 | 257 31 | 4 1 | 813 |
| Interior | 0 0 | 131 86 | 22 14 | 0 0 | 153 |
| East | 0 0 | 71 59 | 48 40 | 1 1 | 120 |
| Coast | 0 0 | 127 61 | 81 39 | 1 0 | 209 |
| N.W | 1 1 | 53 67 | 25 32 | 0 0 | 79 |
| Fiji II | 0 0 | 130 98 | 0 0 | 2 2 | 132 |
| Solomons | 0 0 | 85 100 | 0 0 | 0 0 | 85 |
| Tonga | 0 3 | 0 94 | 0 0 | 0 3 | 0 |
A little more than two-thirds of Fijians' eyes are described as dark brown. The remaining third have medium-brown eyes. There were four individuals who were light brown. Howells, with his Fijian series, is more generous with the darker designation; he designated 98 per cent as dark brown and 2 per cent light brown. His Solomons sample is described as dark brown without exception. The Tongan data also is recorded as more uniformly dark brown than my Fijians.
The Fijians of the interior of Viti Levu have more deeply pigmented eyes than the others; 86 per cent are classed as dark brown and only 14 per cent medium brown.
HAIR
Hair Form
| Straight | Low Wave | Deep Wave | Curl | Frizz | Wool | Total | |
| No. % | No. % | No. % | No. % | No. % | No. % | ||
| Total sample | 0 0 | 7 0.1 | 13 0.2 | 91 11.0 | 702 862 | 0 0 | 813 |
| Interior | 0 0 | 0 0 | 0 0 | 4 3 | 149 97 | 0 0 | 153 |
| East | 0 0 | 1 1 | 10 8 | 37 31 | 72 60 | 0 0 | 120 |
| Coast | 0 0 | 0 1 | 3 0 | 18 9 | 188 90 | 0 0 | 209 |
| N.W. | 0 0 | 2 3 | 0 0 | 7 9 | 70 89 | 0 0 | 79 |
| Fiji II | 0 0 | 0 0 | 0 0 | 19 16 | 38 33 | 59 51 | 116 |
| Solomons | 2 3.3 | 1 1.6 | 0 0 | 16 26 | 17 28 | 25 41 | 61 |
Frizzly hair is the condition of over 85 per cent of Fijians; 11 per cent are curly-haired, whereas over twenty individuals have wavy hair. Straight hair is absent. The Fiji II series of Howell distinguishes between frizzly and wooly hair, which I do not. Their combined incidence is 83 per cent, quite close to my frequency of frizzly. Whether one does or does not distinguish between frizzly and wooly hair, there is no doubt that most Fijians have Negroid hair form. The Solomon Islanders are surprising with somewhat less Negroid hair form than the Fijians. Their combined percentage of frizzly and wooly is 69, which is nearly 20 per cent less than that of the Fijians. Twenty per cent have curly hair against 11 per cent among Fijians. Also, the only instances of straight hair occur in the Solomons.
In the Fijian breakdown, the interior groups have the most Negroid hair; 97 per cent have frizzly hair and 3 per cent have curly hair. The eastern people are the least Negroid in this respect; frizzly hair drops to 60 per cent, whereas curly hair advances to 30 per cent and wavy hair to 9 per cent. The coastal and northwestern series are closer to the interior groups with about 90 per cent frizzly hair.
Hair Texture
| Course | Medium | Fine | Total | |
| No. % | No. % | No. % | ||
| Total sample | 804 99 | 9 1 | 0 0 | 813 |
| Interior | 153 100 | 0 0 | 0 0 | 153 |
| East | 116 97 | 4 3 | 0 0 | 120 |
| Coast | 208 100 | 1 0 | 0 0 | 209 |
| N.W. | 78 99 | 1 1 | 0 0 | 79 |
Hair texture is prevailingly coarse; only 1 per cent of the total series shows medium coarseness and none have fine hair. This preponderance of coarse hair is much the same in all the provinces, although the eastern people do depart slightly with a 3 per cent incidence of medium-coarse hair.
It might be added that Fijian hair is quite stiff or wiry. For example, when the hair is unshorn, it stands out like a mop. A Fijian can insert a long stemmed flower in his hair and it will stay in place with no additional fastening.
Head Hair Quantity
| Absent | Subm. | [16] | ++ | +++ | Total | |
| No. % | No. % | No. % | No. % | No. % | ||
| Total sample | 0 0 | 61 7 | 219 27 | 533 65 | 0 0 | 813 |
| Interior | 0 0 | 26 17 | 27 18 | 100 65 | 0 0 | 153 |
| East | 0 0 | 5 4 | 24 20 | 91 76 | 0 0 | 120 |
| Coast | 0 0 | 11 5 | 63 30 | 135 65 | 0 0 | 209 |
| N.W. | 0 0 | 7 9 | 21 27 | 51 65 | 0 0 | 79 |
| Fiji II | 0 0 | 0 0 | 0 0 | 1 1 | 132 92 | 133 |
| Solomons | 0 0 | 0 0 | 0 0 | 5 6 | 80 94 | 85 |
Head hair quantity is pronounced in the majority of Fijians (65 per cent); it is moderate in 27 per cent and submedium in 7 per cent. Howells describes nearly all the Fijians as having very pronounced head hair—99 per cent, which would appear to be a personal difference in appraisal. In any case, the two series agree that Fijians have hair of more than moderate quantity. The Melanesians of the Solomons are also characterized by much head hair.
Regionally, the only significant variation in this trait is shown in the east, where more individuals have a submedium designation. In the absence of age data, this contrast cannot be fairly interpreted.
Hair Length
It might be observed here that although hair length was not included in this survey, on the basis of personal but unrecorded observation, the Fijians conform to the Melanesian pattern. Most Fijian men now cut their hair short in the Western style, but some still do not. Women generally trim their hair but not short. The natural length of head hair is intermediate between the short-haired African Negroes and the long-haired Caucasians and Mongolians.
Baldness
| Absent | Subm. | + | ++ | +++ | Total | |
| No. % | No. % | No. % | No. % | No. % | ||
| Total sample | 731 90 | 40 3 | 30 4 | 12 1 | 0 0 | 813 |
| Interior | 122 80 | 12 8 | 12 8 | 7 5 | 0 0 | 153 |
| East | 112 93 | 3 3 | 4 3 | 1 1 | 0 0 | 120 |
| Coast | 194 93 | 10 5 | 4 2 | 1 0 | 0 0 | 209 |
| N.W. | 72 91 | 1 1 | 3 4 | 3 4 | 0 0 | 79 |
The lack of age correlations also limits the value of data on baldness, but some meaning can nevertheless be extracted. Regardless of age, with an incidence of pronounced baldness of 1 per cent among all adult males and of 4 per cent for a moderate condition, it is a clear indication that Fijians are not prone to loss of head hair.
Beard Quantity
| Absent | Subm. | + | ++ | +++ | Total | |
| No. % | No. % | No. % | No. % | No. % | ||
| Total sample | 0 0 | 234 29 | 370 44 | 208 26 | 1 .01 | 813 |
| Interior | 0 0 | 22 14 | 67 44 | 64 42 | 0 0 | 153 |
| East | 0 0 | 45 38 | 59 49 | 16 13 | 0 0 | 120 |
| Coast | 0 0 | 60 29 | 94 45 | 54 26 | 1 0 | 209 |
| N.W. | 0 0 | 22 28 | 30 38 | 27 34 | 0 0 | 79 |
| Fiji II | ||||||
| cheeks | 27 21 | 2 2 | 44 34 | 46 35 | 12 9 | 131 |
| skin | 9 7 | 0 0 | 52 40 | 56 43 | 14 10 | 131 |
| Solomons | ||||||
| cheeks | 21 25 | 0 0 | 42 49 | 22 26 | 0 0 | 85 |
| chin | 7 8 | 0 0 | 53 62 | 25 29 | 0 0 | 85 |
| Tonga | ||||||
| chin | 0 0 | 0 19 | 0 31 | 50 0 | 0 0 | 0 |
| lower chk. | 0 4 | 0 37 | 0 18 | 40 0 | 0 0 | 0 |
Moderate beard quantity is shown by 44 per cent of Fijians; the remainder are fairly evenly divided between the submedium and pronounced categories. Howells' series, which records beard quantity for the cheeks and chin separately, shows a higher frequency of pronounced and very pronounced designations. However, his data includes many individuals who have no beards at all. Both series are doubtless influenced by the fact that they contain a preponderance of young adult; a greater proportion of older men would have greatly raised the incidence of the pronounced categories.
Nearly all modern Fijians have adopted the Western practice of shaving. Examination of earlier pictures and written description of Fijians leaves no doubt that the majority of mature men possess luxurious beards when nature is unrestrained.
The natives of the Solomon Islands, according to Howells, are a little less bearded than the Fijians.
The Tongans are a little more heavily bearded than the Fijians.
Some geographical variation is indicated by my data. The interior people of Fiji have the highest incidence of face hair; 42 per cent are recorded as pronounced. Least endowed are the eastern Fijians, where 13 per cent have pronounced beards and 38 per cent are submedium. The coastal and northwestern series conform more closely to the overall distribution.
Body Hair[17]
| Absent | Subm. | + | ++ | +++ | Total | |
| No. % | No. % | No. % | No. % | No. % | ||
| Total sample | 0 0 | 243 30 | 328 40 | 162 20 | 80 10 | 813 |
| Interior | 0 0 | 31 20 | 56 37 | 41 27 | 25 16 | 153 |
| East | 0 0 | 55 46 | 45 38 | 14 12 | 6 5 | 120 |
| Coast | 0 0 | 57 27 | 82 39 | 46 22 | 24 11 | 209 |
| N.W. | 0 0 | 16 20 | 36 46 | 19 24 | 8 8 | 79 |
| Tonga | 0 0 | 23 29 | 0 26 | 0 22 | 0 0 | 0 |
The body hair endowment is also not unimpressive. Forty per cent show a moderate condition, 20 per cent are pronounced, and 10 per cent very pronounced; none are totally devoid of body hair; 30 per cent are submedium. Chest hair among the Tongans is somewhat less in evidence; although the majority range from submedium to pronounced, 23 per cent are described as hairless.
The provincial distribution in Fiji follows that of face hair: the interior groups are hairiest and the eastern people least so.
The anatomical distribution of body hair deserves some comment, even though specific observations were made on the chest. Not infrequently the hair is heavier on the upper legs than on the chest. Occasionally, too, the back of the shoulders is quite hairy as well as the belly.
Grayness: Head
| Absent | Subm. | + | ++ | +++ | Total | |
| No. % | No. % | No. % | No. % | No. % | ||
| Total sample | 621 76 | 82 10 | 82 10 | 28 3 | 3 3 | 813 |
| Interior | 80 52 | 37 24 | 19 12 | 17 11 | 0 0 | 153 |
| East | 91 76 | 13 11 | 16 13 | 0 0 | 0 0 | 120 |
| Coast | 176 84 | 14 7 | 17 8 | 2 1 | 0 0 | 209 |
| N.W. | 60 76 | 8 10 | 9 11 | 2 3 | 0 0 | 79 |
Grayness: Beard
| Absent | Subm. | + | ++ | +++ | Total | |
| No. % | No. % | No. % | No. % | No. % | ||
| Total sample | 610 75 | 61 8 | 90 11 | 52 6 | 0 0 | 813 |
| Interior | 72 47 | 30 20 | 20 13 | 31 20 | 0 0 | 153 |
| East | 89 74 | 9 8 | 18 15 | 4 3 | 0 0 | 120 |
| Coast | 178 85 | 8 4 | 21 10 | 2 1 | 0 0 | 209 |
| N.W. | 60 76 | 6 8 | 11 14 | 2 3 | 0 0 | 79 |
Grayness of the hair data without corresponding age incidence is not particularly significant. It is clear, nevertheless, that premature grayness is not common. I would hazard the judgment that on the whole the Fijians show less tendency to grayness than do Caucasians.
The higher incidence of grayness of the interior sample of Fijians is likely due to a larger number of older men in that series.
THE FACE
Prognathism: Total
| Absent | Subm. | + | ++ | Total | |
| No. % | No. % | No. % | No. % | ||
| Fiji I | 206 25 | 306 38 | 288 35 | 13 2 | 813 |
| Interior | 40 26 | 59 39 | 52 34 | 2 1 | 153 |
| East | 54 45 | 55 46 | 11 9 | 0 0 | 120 |
| Coast | 47 22 | 84 40 | 73 35 | 5 2 | 209 |
| N.W. | 18 23 | 29 37 | 32 41 | 0 0 | 79 |
| Tonga | 63 53 | 26 22 | 29 25 | 0 0 | 118 |
Prognathism: Mid-Facial
| Absent | Subm. | + | ++ | Total | |
| No. % | No. % | No. % | No. % | ||
| Fiji I | 517 64 | 184 23 | 109 13 | 3 1/2 | 813 |
| Interior | 133 87 | 15 10 | 5 3 | 0 0 | 153 |
| East | 100 83 | 17 14 | 3 3 | 0 0 | 120 |
| Coast | 122 58 | 49 23 | 37 18 | 1 1 | 209 |
| N.W. | 48 61 | 20 25 | 11 14 | 0 0 | 79 |
Prognathism: Alveolar
| Absent | Subm. | + | ++ | Total | |
| No. % | No. % | No. % | No. % | ||
| Fiji I | 798 98 | 9 1 | 4 1/2 | 2 0 | 813 |
| Interior | 153 100 | 0 0 | 0 0 | 0 0 | 153 |
| East | 120 100 | 0 0 | 0 0 | 0 0 | 120 |
| Coast | 207 99 | 0 0 | 1 1/2 | 1 1/2 | 209 |
| N.W. | 76 {96} | 2 3 | 0 0 | 1 1 | 79 |
Slight and moderate total prognathism characterizes most Fijians.but it is pronounced in only 13 of the 813 subjects. A quarter of the series show no prognathism. The eastern people are least prognathic with a zero incidence of 45 per cent. The other regional sample are close to the general condition.
Mid-facial prognathism has a submedium incidence of 23 per cent and a medium of 13 per cent; the remainder lack the condition, except three individuals who are pronounced.
The coastal and northwestern groups have more frequent medium designations. Alveolar prognathism is almost entirely lacking in all groups.
Malar Projection: Lateral
| Absent | Subm. | + | ++ | +++ | Total | |
| No. % | No. % | No. % | No. % | No. % | ||
| Fiji I | 1 0 | 2 0 | 264 32 | 543 67 | 3 0 | 813 |
| Interior | 0 0 | 0 0 | 62 41 | 91 59 | 0 0 | 153 |
| East | 0 0 | 0 0 | 25 21 | 95 79 | 0 0 | 120 |
| Coast | 0 0 | 0 0 | 68 33 | 141 67 | 0 0 | 209 |
| N.W. | 0 0 | 0 0 | 28 35 | 50 63 | 1 1 | 79 |
Malar Projection: Frontal
| Absent | Subm. | + | ++ | Total | |
| No. % | No. % | No. % | No. % | ||
| Fiji I | 4 1/2 | 0 0 | 709 87 | 100 12 | 809 |
| Interior | 0 0 | 0 0 | 139 91 | 14 9 | 153 |
| East | 0 0 | 0 0 | 103 86 | 17 14 | 120 |
| Coast | 1 0 | 0 0 | 181 87 | 27 13 | 209 |
| N.W. | 0 0 | 0 0 | 67 85 | 12 15 | 79 |
The facial contours generally include lateral malar projection; two-thirds show a pronounced condition and the balance are medium. The eastern people have high cheek bones oftener than do the others.
Frontal malar projection is also common but more often moderately so; 87 per cent show medium projection and 12 per cent are pronounced.
Gonial Angles
| Sbm. | + | ++ | +++ | Total | |
| No. % | No. % | No. % | No. % | ||
| Fiji I | 24 3 | 459 56 | 325 40 | 5 1 | 813 |
| Interior | 0 0 | 97 63 | 55 36 | 1 1 | 153 |
| East | 1 1 | 65 54 | 54 45 | 0 0 | 120 |
| Coast | 7 3 | 110 53 | 90 43 | 2 1 | 209 |
| N.W. | 3 4 | 49 62 | 27 34 | 0 0 | 79 |
Palate Shape
| Parabolic | Sm. U | Lg. U | Square | Total | |
| No. % | No. % | No. % | No. % | ||
| Fiji I | 493 61 | 2 0 | 303 37 | 15 2 | 813 |
| Interior | 94 61 | 0 0 | 59 39 | 0 0 | 153 |
| East | 81 68 | 0 0 | 38 32 | 1 1 | 120 |
| Coast | 131 63 | 0 0 | 71 34 | 7 3 | 209 |
| N.W. | 50 63 | 1 1 | 27 34 | 1 1 | 79 |
A fairly strong tendency to well-developed gonial angles is indicated; 40 per cent show pronounced angles and nearly all the rest are medium. These proportions hold pretty much for all groups.
Palate shape also attests to the well-developed jaws of Fijians; it is a large U in 37 per cent of the subjects; 2 per cent are square and the remainder parabolic.
Chin Prominence
| Absent | Subm. | + | ++ | Total | |
| No. % | No. % | No. % | No. % | ||
| Fiji I | 2 0 | 164 20 | 593 73 | 54 7 | 813 |
| Interior | 0 0 | 36 24 | 110 72 | 7 5 | 153 |
| East | 0 0 | 25 21 | 89 74 | 6 5 | 120 |
| Coast | 0 0 | 41 20 | 153 73 | 13 6 | 207 |
| N.W. | 1 1 | 11 14 | 55 70 | 9 11 | 76 |
Chin Type
| Median | Bilateral | Total | |
| No. % | No. % | ||
| Fiji I | 673 83 | 140 17 | 813 |
| Interior | 130 85 | 23 15 | 153 |
| East | 112 93 | 8 7 | 120 |
| Coast | 162 78 | 45 22 | 207 |
| N.W. | 62 82 | 14 18 | 76 |
A well-developed chin further typifies most Fijian faces; nearly three-quarters have a moderate chin prominence, 7 per cent are pronounced, and the remainder are submedium. This range is much the same in the subgroups.
The chin is commonly median although 17 per cent have the bilateral type. The bilateral chin is least frequent in Lau (7 per cent).
THE HEAD
Temporal Fullness
| Absent | Subm. | + | Total | |
| No. % | No. % | No. % | ||
| Fiji I | 1 0 | 563 69 | 249 31 | 813 |
| Interior | 0 0 | 113 74 | 40 26 | 153 |
| East | 0 0 | 70 58 | 50 42 | 120 |
| Coast | 1 0 | 148 71 | 60 29 | 208 |
| N.W. | 0 0 | 59 75 | 20 25 | 79 |
Occipital Protrusion
| Absent | Subm. | + | Total | |
| No. % | No. % | No. % | ||
| Fiji I | 13 2 | 775 95 | 25 3 | 813 |
| Interior | 4 3 | 149 97 | 0 0 | 153 |
| East | 0 0 | 116 97 | 4 3 | 120 |
| Coast | 3 1 | 193 92 | 13 6 | 209 |
| N.W. | 0 0 | 79 100 | 0 0 | 79 |
A narrowness in the temporal part of the head is indicated. Sixty-nine per cent of the subject show submedium temporal fullness, whereas the remainder are moderate. This condition is not marked and may best be described as a discernable tendency.
The back of the head is generally rather flat as the 95 per cent incidence of occipital protrusion indicates. This is a natural condition; no intentional flattening is practiced by Fijians.
Lambdoidal Flattening
| Absent | Subm. | + | Total | |
| No. % | No. % | No. % | ||
| Fiji I | 754 93 | 32 4 | 27 3 | 813 |
| Interior | 153 100 | 0 0 | 0 0 | 153 |
| East | 113 94 | 5 4 | 2 2 | 120 |
| Coast | 188 90 | 13 6 | 8 4 | 209 |
| N.W. | 72 91 | 3 4 | 4 5 | 79 |
Occipital Flattening
| Absent | Subm. | + | Total | |
| No. % | No. % | No. % | ||
| Fiji I | 809 100 | 2 0 | 2 0 | 813 |
| Interior | 153 100 | 0 0 | 0 0 | 153 |
| East | 120 100 | 0 0 | 0 0 | 120 |
| Coast | 209 100 | 0 0 | 0 0 | 209 |
| N.W. | 79 99 | 0 0 | 1 1 | 79 |
Median Sagittal Crest
| Absent | Subm. | + | Total | |
| No. % | No. % | No. % | ||
| Fiji I | 600 74 | 177 22 | 36 4 | 813 |
| Interior | 96 63 | 46 30 | 11 7 | 153 |
| East | 109 91 | 10 8 | 1 1 | 120 |
| Coast | 160 77 | 43 21 | 6 3 | 209 |
| N.W. | 53 57 | 24 30 | 2 3 | 79 |
Parietal Bosses
| Absent | Subm. | + | ++ | Total | |
| No. % | No. % | No. % | No. % | ||
| Fiji I | 17 2 | 413 51 | 381 47 | 2 0 | 813 |
| Interior | 1 1 | 130 85 | 22 14 | 0 0 | 153 |
| East | 4 3 | 66 55 | 50 42 | 0 0 | 120 |
| Coast | 6 3 | 82 39 | 120 57 | 1 0 | 209 |
| N.W. | 1 1 | 40 51 | 38 48 | 0 0 | 79 |
A median sagittal crest though not striking is recorded in a number of cases. It has a submedium incidence of 22 per cent and pronounced 4 per cent. Among the interior people, the crest is more common. Because of the heavy, bushy, and wiry hair of Fijians it is probable that some instances of this feature were not detected by simple palpation, and the incidence may be higher than the data indicate.
Submedium development of the parietal bosses is rather common occurring in 51 per cent of the series. It is very common in the interior (85 per cent).
Cranial Asymmetry
| Absent | Left | Right | Total | |
| No. % | No. % | No. % | ||
| Fiji | 813 100 | 0 0 | 0 0 | 813 |
| Interior | 153 100 | 0 0 | 0 0 | 153 |
| East | 119 100 | 0 0 | 0 0 | 119 |
| Coast | 208 100 | 0 0 | 0 0 | 208 |
| N.W. | 79 100 | 0 0 | 0 0 | 79 |
Facial Asymmetry
| Absent | Left | Right | Total | |
| No. % | No. % | No. % | ||
| Fiji | 806 100 | 1 0 | 0 0 | 807 |
| Interior | 153 100 | 0 0 | 0 0 | 153 |
| East | 117 98 | 0 0 | 2 2 | 119 |
| Coast | 206 99 | 0 0 | 2 1 | 208 |
| N.W. | 78 99 | 1 0 | 0 0 | 79 |
Cranial and facial assymetry are generally lacking, at least in any marked degree. Normal asymmetries of the face and head were ignored in this description.
EYES
Eye Folds: External
| Absent | Subm. | + | ++ | Total | |
| No. % | No. % | No. % | No. % | ||
| Fiji | 804 98 | 5 1 | 4 1 | 0 0 | 813 |
| Interior | 152 99 | 0 0 | 1 1 | 0 0 | 153 |
| East | 119 99 | 0 0 | 1 1 | 0 0 | 120 |
| Coast | 209 99 | 1 1 | 1 1 | 0 0 | 208 |
| N.W. | 78 99 | 0 0 | 1 1 | 0 0 | 79 |
Eye Fold: Median
| Absent | Subm. | + | ++ | Total | |
| No. % | No. % | No. % | No. % | ||
| Fiji I | 782 96 | 3 1/2 | 25 3 | 3 1/2 | 813 |
| Interior | 152 99 | 0 0 | 1 1 | 0 0 | 153 |
| East | 108 90 | 1 1 | 10 8 | 1 1 | 120 |
| Coast | 202 97 | 1 0 | 5 2 | 1 0 | 209 |
| N.W. | 78 99 | 0 0 | 0 0 | 1 1 | 79 |
Eye Folds: Internal
| Absent | Subm. | + | ++ | Total | |
| No. % | No. % | No. % | No. % | ||
| Fiji I | 778 96 | 4 0 | 30 4 | 1 0 | 813 |
| Interior | 151 99 | 0 0 | 2 1 | 0 0 | 153 |
| East | 102 85 | 1 1 | 17 14 | 1 0 | 120 |
| Coast | 203 97 | 0 0 | 6 3 | 0 0 | 209 |
| N.W. | 78 99 | 0 0 | 1 1 | 0 0 | 79 |
| Fiji II | 116 89 | 7 5-1/2 | 7 5-1/2 | 0 0 | 130 |
| Solomons | 80 94 | 2 2-1/2 | 3 3-1/2 | 0 0 | 85 |
| Tonga | 63 57 | 33 30 | 9 8 | 6 5 | 111 |
Eye folds are not a feature of the Fijian facial make-up. The external fold is present in only 2 per cent of the total series. The median fold shows a 96 per cent absence. The eastern groups exceed the other provinces with a 10 per cent occurrence. The internal eye fold has a total presence of 4 per cent and is also commoner in the east (14 per cent).
Eye Obliquity
| Absent | Subm. | + | ++ | Total | |
| No. % | No. % | No. % | No. % | ||
| Fiji I | 251 31 | 358 43 | 201 25 | 3 1 | 813 |
| Interior | 92 60 | 46 30 | 14 9 | 1 1 | 153 |
| East | 33 28 | 52 35 | 45 38 | 0 0 | 120 |
| Coast | 47 22 | 102 49 | 58 28 | 2 1 | 209 |
| N.W. | 27 34 | 32 41 | 20 25 | 0 0 | 79 |
Eye Opening
| Absent | Subm. | + | ++ | Total | |
| No. % | No. % | No. % | No. % | ||
| Fiji I | 0 0 | 75 9-1/2 | 737 91 | 1 1/2 | 813 |
| Interior | 0 0 | 24 16 | 128 84 | 1 1 | 153 |
| East | 0 0 | 13 11 | 107 89 | 0 0 | 120 |
| Coast | 0 0 | 9 4 | 200 96 | 0 0 | 209 |
| N.W. | 0 0 | 7 9 | 72 91 | 0 0 | 79 |
Some degree of eye obliquity is present in the majority of cases; 43 per cent show a submedium condition; 25 per cent are medium and three individuals have pronouncedly oblique eyes. The remainder, or 31 per cent, have no obliquity. In the east, the natives depart from this total distribution in opposite directions. The interior groups have much less eye obliquity; the eastern people, a great deal more. The other provinces are quite close to the total frequencies.
Eye opening height is preponderately moderate (91 per cent). The remaining 10 per cent with one exception show submedium eye opening. Regional variation is not great. The eastern and interior groups have a little higher frequency in the submedium class.
FOREHEAD
Brow Ridges
| Absent | Subm. | + | ++ | +++ | Total | |
| No. % | No. % | No. % | No. % | No. % | ||
| Fiji I | 0 0 | 148 19 | 364 44 | 295 36 | 6 1 | 813 |
| Interior | 0 0 | 16 10 | 69 45 | 64 42 | 4 3 | 153 |
| East | 0 0 | 28 23 | 42 35 | 50 42 | 0 0 | 120 |
| Coast | 0 0 | 42 20 | 99 47 | 67 32 | 1 0 | 209 |
| N.W. | 0 0 | 19 24 | 40 51 | 19 24 | 1 1 | 79 |
Brow ridges are a marked feature of Fijians in general. None of them lack some supraorbital development. Forty-four per cent have medium brow ridges, 36 per cent are pronounced, and 1 per cent are very pronounced. The other 19 per cent are small. The interior and eastern groups share a little higher incidence of pronounced brow ridges; the other regions are nearer the total distribution of variations.
Forehead Height
| Absent | Subm. | + | ++ | Total | |
| No. % | No. % | No. % | No. % | ||
| Fiji I | 0 0 | 444 55 | 369 45 | 0 0 | 813 |
| Interior | 0 0 | 90 59 | 63 41 | 0 0 | 153 |
| East | 0 0 | 68 57 | 52 43 | 0 0 | 120 |
| Coast | 0 0 | 110 53 | 99 47 | 0 0 | 209 |
| N.W. | 0 0 | 46 58 | 33 42 | 0 0 | 79 |
Forehead Slope
| Absent | Subm. | + | ++ | Total | |
| No. % | No. % | No. % | No. % | ||
| Fiji I | 8 1 | 280 34 | 460 56 | 65 8 | 813 |
| Interior | 0 0 | 53 35 | 87 57 | 13 8 | 153 |
| East | 0 0 | 38 32 | 72 60 | 10 8 | 120 |
| Coast | 4 2 | 78 37 | 113 54 | 14 7 | 209 |
| N.W. | 2 3 | 27 34 | 47 59 | 4 4 | 79 |
| Tonga | 1 1 | 70 60 | 45 39 | 0 0 | 116 |
Forehead height is submedium in more than half the cases (55 per cent); the others are all medium. There is no significant variation among the subgroups.
A sloping forehead is quite characteristic of the Fijian head; 56 per cent are moderately sloping, 8 per cent are pronounced, and 34 per cent are submedium. Only 1 per cent have foreheads with no recession. Regional differences are very slight.
NOSE
Nasion Depression
| Absent | Subm. | + | ++ | Total | |
| No. % | No. % | No. % | No. % | ||
| Fiji I | 1 0 | 170 21 | 579 71 | 63 8 | 813 |
| Interior | 0 0 | 41 27 | 103 67 | 9 6 | 153 |
| East | 1 1 | 32 27 | 85 71 | 2 2 | 120 |
| Coast | 0 0 | 45 22 | 144 69 | 10 10 | 209 |
| N.W. | 0 0 | 18 23 | 56 71 | 6 6 | 79 |
Root Height
| Absent | Subm. | + | ++ | Total | |
| No. % | No. % | No. % | No. % | ||
| Fiji I | 1 0 | 63 8 | 555 67 | 194 24 | 813 |
| Interior | 0 0 | 16 10 | 96 63 | 41 27 | 153 |
| East | 1 1 | 3 3 | 77 64 | 39 33 | 120 |
| Coast | 0 0 | 10 5 | 157 75 | 42 20 | 209 |
| N.W. | 0 0 | 4 5 | 57 72 | 18 23 | 79 |
Root Breadth
| Absent | Subm. | + | ++ | Total | |
| No. % | No. % | No. % | No. % | ||
| Fiji I | 0 0 | 1 0 | 258 32 | 554 68 | 813 |
| Interior | 0 0 | 0 0 | 38 25 | 115 75 | 153 |
| East | 0 0 | 1 1 | 53 44 | 66 55 | 120 |
| Coast | 0 0 | 0 0 | 67 32 | 142 68 | 209 |
| N.W. | 0 0 | 0 0 | 24 30 | 55 70 | 79 |
Nasal Septum
| Straight | Concave | Convex | Total | |
| No. % | No. % | No. % | ||
| Fiji I | 777 99 | 0 0 | 36 4 | 813 |
| Interior | 153 100 | 0 0 | 0 0 | 153 |
| East | 118 98 | 0 0 | 2 2 | 120 |
| Coast | 196 94 | 0 0 | 13 6 | 199 |
| N.W. | 78 99 | 0 0 | 1 1 | 79 |
Bridge Height
| Absent | Subm. | + | ++ | Total | |
| No. % | No. % | No. % | No. % | ||
| Fiji I | 0 0 | 54 7 | 644 79 | 115 14 | 813 |
| Interior | 0 0 | 13 8 | 124 81 | 16 10 | 153 |
| East | 0 0 | 1 1 | 98 82 | 21 18 | 120 |
| Coast | 0 0 | 10 5 | 173 83 | 26 12 | 209 |
| N.W. | 0 0 | 7 9 | 60 76 | 12 15 | 79 |
| Tonga | 0 0 | 21 22 | 81 70 | 9 8 | 111 |
Bridge Breadth
| Absent | Subm. | + | ++ | Total | |
| No. % | No. % | No. % | No. % | ||
| Fiji I | 0 0 | 0 0 | 265 33 | 546 67 | 813 |
| Interior | 0 0 | 0 0 | 29 19 | 124 81 | 153 |
| East | 0 0 | 0 0 | 72 60 | 48 40 | 120 |
| Coast | 0 0 | 0 0 | 62 30 | 147 70 | 209 |
| N.W. | 0 0 | 0 0 | 23 29 | 56 71 | 79 |
Nasal Profile
| Concave | Straight | Convex | Total | |
| No. % | No. % | No. % | ||
| Fiji I | 14 2 | 625 77 | 173 21 | 812 |
| Interior | 0 0 | 123 80 | 30 20 | 153 |
| East | 1 1 | 88 73 | 31 26 | 120 |
| Coast | 4 2 | 171 82 | 34 16 | 209 |
| N.W. | 1 1 | 59 75 | 19 24 | 79 |
Moderate nasion depression characterizes the majority of noses (71 per cent). Pronounced depression is recorded for 8 per cent, and submedium occurrence in 21 per cent. Only one individual lacks any depression. This distribution does not vary much among the provinces.
A well-elevated nasal root is also characteristic; 67 per cent show moderate elevation and 24 per cent pronounced, whereas 8 per cent are submedium; one individual is without any elevation. The interior Fijians have a little higher frequency of low nasal root (10 per cent), whereas the eastern people, with a 30 per cent incidence, excel in the pronounced category.
More striking is the breadth of the Fijian nasal root. It is pronounced [Pg 20] in 68 per cent and moderate in the remainder of the series. Pronounced breadth is commoner among the interior people (75 per cent) and least preponderant in the east (55 per cent).
The nasal septum is nearly always straight; the only departure from this condition is a 4 per cent incidence of convexity. Regional differences are not significant.
Nasal bridge height is commonly medium (79 per cent) in the totality of noses. Fourteen percent are pronouncedly high and 7 per cent are submedium. The several provinces do not depart very far from this distribution.
The Fijian nose shows a strong tendency to broadness of the bridge. Two-thirds show pronounced breadth of bridge and the remainder are medium. Pronounced broadness increases in the interior groups (81 per cent) and shows a marked decline in the east (40 per cent).
Nasal profiles are most often straight (77 per cent), but convex noses are not uncommon (21 per cent). Convexity is slightly more frequent in the east (26 percent), whereas in the coastal people its incidence drops to 16 per cent.
Nasal-Tip Thickness
| Subm. | + | ++ | +++ | Total | |
| No. % | No. % | No. % | No. % | ||
| Fiji I | 1 0 | 344 42 | 461 58 | 1 0 | 812 |
| Interior | 0 0 | 55 36 | 98 64 | 0 0 | 153 |
| East | 1 1 | 80 67 | 39 33 | 0 0 | 120 |
| Coast | 0 0 | 94 45 | 114 55 | 1 1 | 209 |
| N.W. | 0 0 | 27 34 | 52 66 | 0 0 | 79 |
Nasal-Tip Inclination
| Absent | Subm. | + | ++ | Total | |
| No. % | No. % | No. % | No. % | ||
| Fiji I | 731 90 | 57 7 | 24 3 | 0 0 | 812 |
| Interior | 147 96 | 6 4 | 0 0 | 0 0 | 153 |
| East | 109 91 | 6 5 | 5 4 | 0 0 | 120 |
| Coast | 186 89 | 16 8 | 7 3 | 0 0 | 209 |
| N.W. | 71 90 | 6 8 | 2 3 | 0 0 | 79 |
Nasal Wings
| Compressed | Medium | Flaring | Total | |
| No. % | No. % | No. % | ||
| Fiji I | 0 0 | 198 24 | 615 76 | 813 |
| Interior | 0 0 | 25 16 | 128 84 | 153 |
| East | 0 0 | 70 58 | 50 42 | 120 |
| Coast | 0 0 | 42 20 | 167 80 | 209 |
| N.W. | 0 0 | 16 20 | 63 80 | 79 |
The nasal tip is pronounced more often than not, 58 per cent showing this condition. The remaining 42 per cent have tips of medium thickness. Thicker tips occur more often in the interior (64 per cent) and in the northwest (66 per cent), least often in the east (33 per cent).
Usually the nasal tip is not inclined downward. Slight and moderate inclination has a combined incidence of only 10 per cent.
Flaring nasal wings are a common condition (76 per cent). This incidence rises to 84 per cent in the interior and drops to 42 per cent in the east.
MOUTH
Lip Thickness: Membranous
| Subm. | + | ++ | +++ | Total | |
| No. % | No. % | No. % | No. % | ||
| Fiji I | 19 2 | 428 53 | 364 45 | 2 0 | 813 |
| Interior | 10 7 | 43 28 | 100 65 | 0 0 | 153 |
| East | 1 1 | 83 69 | 36 30 | 0 0 | 120 |
| Coast | 1 1/2 | 88 42 | 119 57 | 1 1/2 | 209 |
| N.W. | 4 5 | 39 49 | 36 46 | 0 0 | 79 |
| Tonga | 12 10 | 97 84 | 7 6 | 0 0 | 116 |
Lip Thickness: Integumental
| Subm. | + | ++ | +++ | Total | |
| No. % | No. % | No. % | No. % | ||
| Fiji I | 4 1/2 | 608 75 | 201 25 | 0 0 | 813 |
| Interior | 1 1/2 | 114 75 | 38 25 | 0 0 | 153 |
| East | 1 1 | 100 83 | 19 16 | 0 0 | 120 |
| Coast | 2 1 | 164 78 | 43 21 | 0 0 | 209 |
| N.W. | 0 0 | 55 70 | 24 30 | 0 0 | 79 |
| Fiji II | 0 0 | 1 1/2 | 26 20 | 106 80 | 133 |
| Solomons | 0 0 | 0 0 | 12 14 | 73 86 | 85 |
Lip Eversion
| Absent | Subm. | + | ++ | Total | |
| No. % | No. % | No. % | No. % | ||
| Fiji I | 12 1 | 333 41 | 444 55 | 24 3 | 813 |
| Interior | 0 0 | 63 41 | 88 58 | 2 1 | 153 |
| East | 8 7 | 77 64 | 35 29 | 0 0 | 120 |
| Coast | 0 0 | 63 30 | 138 66 | 8 4 | 209 |
| N.W. | 1 1 | 26 33 | 51 65 | 1 1 | 79 |
Lip Seam
| Absent | Subm. | + | ++ | Total | |
| No. % | No. % | No. % | No. % | ||
| Fiji I | 33 4 | 429 53 | 343 42 | 8 1 | 813 |
| Interior | 1 1 | 79 52 | 73 48 | 0 0 | 153 |
| East | 14 12 | 77 64 | 29 24 | 0 0 | 120 |
| Coast | 6 3 | 105 50 | 94 45 | 4 2 | 209 |
| N.W. | 3 4 | 44 56 | 32 41 | 0 0 | 79 |
Fijian lips are Negroid in thickness in many instances. Membranous lips are thick in 45 per cent of the series, medium in 53 per cent, and submedium in 25 per cent. Thickest lips occur in the interior and coastal areas where the pronounced type registers 65 per cent and 57 per cent, respectively. In the east, lips are more moderate in thickness, and the pronounced category drops to 30 per cent.
Integumental lips also tend to be heavy but not so much as the mucous parts. Twenty-five per cent of the total Fijians have thick integumental lips and the remainder are moderate. Howells' Fiji II series classes 80 per cent as very pronounced and the remainder as pronounced. The Solomon Islanders, with an 86 per cent incidence of very pronounced, have the heaviest lips of all.
Lip eversion varies largely between moderate and submedium, 55 percent and 41 per cent, respectively. The interior and coastal Fijians show this trait a little more often than the others, whereas the eastern people have least lip eversion. The lip seam is present in nearly all cases, but not to a pronounced degree. Fifty-three per cent are submedium and 42 per cent are moderate. The eastern groups are definitely less endowed with this trait. The other provinces vary but little from the total distribution.
TEETH
Bite
| Under | E-E | Subm. over | + over | Total | |
| No. % | No. % | No. % | No. % | ||
| Fiji I | 2 0 | 518 64 | 274 34 | 13 2 | 807 |
| Interior | 0 0 | 94 61 | 59 39 | 0 0 | 153 |
| East | 0 0 | 73 61 | 45 38 | 2 2 | 120 |
| Coast | 1 0 | 130 62 | 76 36 | 0 0 | 207 |
| N.W. | 1 1 | 49 62 | 23 29 | 3 4 | 76 |
| Fiji II | 4 3 | 50 38 | 77 59 | 0 0 | 131 |
| Solomons | 1 1 | 37 45 | 45 54 | 0 0 | 83 |
Caries
| Absent | Subm.(1-4) | + (5-8) | ++ (9-16) | +++ (17-x) | Total | |
| No. % | No. % | No. % | No. % | No. % | ||
| Fiji I | 645 78 | 80 10 | 58 7 | 22 3 | 8 1 | 813 |
| Interior | 130 84 | 16 10 | 3 2 | 1 1 | 3 2 | 153 |
| East | 100 83 | 10 12 | 4 3 | 2 1 | 4 3 | 120 |
| Coast | 153 73 | 29 14 | 16 8 | 8 4 | 3 1 | 209 |
| N.W. | 62 80 | 9 11 | 6 8 | 1 1 | 0 0 | 78 |
Crowding
| Absent | Subm. | + | ++ | Total | |
| No. % | No. % | No. % | No. % | ||
| Fiji I | 685 84 | 115 14 | 13 2 | 0 0 | 813 |
| Interior | 134 88 | 19 12 | 0 0 | 0 0 | 153 |
| East | 100 83 | 17 14 | 3 3 | 0 0 | 120 |
| Coast | 180 86 | 25 12 | 4 2 | 0 0 | 209 |
| N.W. | 64 81 | 14 18 | 0 0 | 0 0 | 78 |
Tooth Eruption
| Complete | Incomplete | Total | |
| No. % | No. % | ||
| Fiji I | 796 98 | 15 2 | 811 |
| Interior | 153 100 | 0 0 | 153 |
| East | 119 99 | 1 1 | 120 |
| Coast | 199 95 | 8 4 | 207 |
| N.W. | 74 94 | 2 3 | 76 |
Wear
| Absent | Subm. | + | ++ | Total | |
| No. % | No. % | No. % | No. % | ||
| Fiji I | 184 23 | 443 54 | 144 18 | 42 5 | 813 |
| Interior | 27 {18} | 58 {38} | 37 {24} | 31 {20} | 153 |
| East | 26 {22} | 69 {57} | 24 {20} | 1 {1} | 120 |
| Coast | 60 {29} | 120 {57} | 28 {13} | 1 {1/2} | 209 |
| N.W. | 12 {15} | 47 {60} | 17 {22} | 2 {3} | 78 |
The jaws of Fijians have a rather distinctive frequency of edge-to-edge bite. I recorded this as 64 per cent, but Howells' series indicates a 38 per cent incidence.
The quality of Fijian teeth as reflected by frequency of caries is excellent. Nearly 80 per cent of the total show no tooth decay. The soundest teeth from this standpoint occur in the interior, the east, and the northwest. The coastal people show the highest incidence of caries, an interesting point since many of this sample come from around Suva and have more access to the Western processed foods.
Tooth crowding is quite uncommon to Fijians, a condition consistent with their generous jaw conformation. Crowding is noted in only 16 per cent of the series, and most of it is slight.
Tooth eruption is complete in nearly all the subjects. A 2 per cent incidence of incomplete eruption is entirely due to the immaturity of some of the young adults. No pathological suppression was noted.
Some wear of the teeth is recorded for more than three-quarters of the series, but lacking age incidence, the data has limited meaning. The Fijian diet is not abrasive the way, for instance, it is for the Indians of our Southwest, where the staple food is ground in stone mills.
EARS
Ear Helix
| Subm. | + | ++ | +++ | Total | |
| No. % | No. % | No. % | No. % | ||
| Fiji I | 230 28 | 511 63 | 72 9 | 0 0 | 813 |
| Interior | 45 29 | 99 65 | 9 6 | 0 0 | 153 |
| East | 29 24 | 74 62 | 17 14 | 0 0 | 120 |
| Coast | 58 28 | 128 61 | 23 11 | 0 0 | 209 |
| N.W. | 24 30 | 51 65 | 4 5 | 0 0 | 79 |
Darwin's Point
| Absent | Subm. | + | ++ | Total | |
| No. % | No. % | No. % | No. % | ||
| Fiji I | 761 94 | 36 4 | 15 2 | 1 0 | 813 |
| Interior | 150 98 | 3 2 | 0 0 | 0 0 | 153 |
| East | 112 93 | 6 5 | 2 2 | 0 0 | 120 |
| Coast | 187 89 | 13 6 | 4 4 | 1 0 | 209 |
| N.W. | 77 97 | 2 3 | 0 0 | 0 0 | 79 |
Ear-Lobe Type
| Soldered | Attached | Free | Total | |
| No. % | No. % | No. % | ||
| Fiji I | 80 10 | 531 65 | 202 25 | 813 |
| Interior | 47 31 | 74 48 | 32 21 | 153 |
| East | 3 3 | 85 71 | 32 27 | 120 |
| Coast | 9 4 | 141 67 | 59 28 | 209 |
| N.W. | 5 6 | 52 66 | 22 28 | 79 |
Ear-Lobe Size
| Subm. | + | ++ | +++ | Total | |
| No. % | No. % | No. % | No. % | ||
| Fiji I | 176 22 | 457 56 | 178 22 | 2 0 | 813 |
| Interior | 49 32 | 66 43 | 38 25 | 0 0 | 153 |
| East | 16 13 | 76 63 | 27 23 | 1 1 | 120 |
| Coast | 31 15 | 123 59 | 55 26 | 0 0 | 209 |
| N.W. | 20 25 | 47 59 | 12 15 | 0 0 | 79 |
Ear Protrusion
| Absent | Subm. | + | ++ | Total | |
| No. % | No. % | No. % | No. % | ||
| Fiji I | 2 0 | 262 32 | 463 57 | 86 11 | 813 |
| Interior | 1 1 | 47 31 | 90 59 | 15 10 | 153 |
| East | 0 0 | 31 26 | 77 64 | 12 10 | 120 |
| Coast | 1 0 | 75 36 | 114 55 | 19 9 | 209 |
| N.W. | 0 0 | 26 33 | 49 62 | 4 5 | 79 |
Ear Slant
| Absent | Subm. | + | Total | |
| No. % | No. % | No. % | ||
| Fiji I | 416 51 | 332 41 | 65 8 | 813 |
| Interior | 78 51 | 67 44 | 8 5 | 153 |
| East | 55 46 | 52 43 | 13 11 | 120 |
| Coast | 118 56 | 74 35 | 17 8 | 209 |
| N.W. | 38 48 | 39 49 | 2 3 | 79 |
The Fijian ear is a moderately distinctive appendage from a racial standpoint. The helix shows moderate development on the whole and is submedium otherwise except for a 9 per cent incidence of pronounced appearance. Regional variation is small.
The Darwin's point is noted in a number of cases: 4 per cent to a submedium degree and 2 per cent medium.
The ear lobe is somewhat distinctive with a 65 per cent incidence of the attached condition and 10 per cent soldered. The remaining 25 per cent is free. This distinctiveness is more marked among the interior groups where the soldered type of lobe increases to 31 percent.
Ear-lobe size is moderate in more than half the series, pronounced in 22 per cent, and submedium in 22 per cent. Small lobes are commoner in the interior province.
Moderate ear protrusion is the commonest form followed by submedium. Marked projection is recorded as 11 per cent.
Ear slant either is lacking or slight in most instances; the series is rather evenly divided between these two categories, the zero category having a small majority. Moderate slant is noted for 8 per cent.
BODY BUILD
Body Build: Endomorph
| 1 | 2 | 3 | 4 | 5 | 6 | Total | |
| No. % | No. % | No. % | No. % | No. % | No. % | ||
| Fiji I | 260 32 | 334 42 | 126 15 | 46 6 | 33 4 | 12 1 | 811 |
| Interior | 49 32 | 66 43 | 26 17 | 5 3 | 6 4 | 1 1 | 153 |
| East | 30 25 | 54 45 | 21 18 | 5 4 | 8 7 | 1 1 | 119 |
| Coast | 77 37 | 82 39 | 28 13 | 10 5 | 8 4 | 3 1 | 209 |
| N.W. | 26 33 | 34 43 | 9 11 | 6 8 | 2 3 | 2 3 | 79 |
Body Build: Mesomorph
| 1 | 2 | 3 | 4 | 5 | 6 | Total | |
| No. % | No. % | No. % | No. % | No. % | No. % | ||
| Fiji I | 1 {0.1} | 2 {0.2} | 33 4 | 131 16 | 227 28 | 419 52 | 813 |
| Interior | 0 0 | 1 1 | 11 7 | 27 18 | 41 27 | 73 48 | 153 |
| East | 1 1 | 0 0 | 2 2 | 14 12 | 38 32 | 65 54 | 120 |
| Coast | 0 0 | 0 0 | 9 4 | 29 14 | 67 32 | 104 50 | 209 |
| N.W. | 0 0 | 1 1 | 2 3 | 15 19 | 14 18 | 47 59 | 79 |
Body Build: Ectomorph
| 1 | 2 | 3 | 4 | 5 | 6 | Total | |
| No. % | No. % | No. % | No. % | No. % | No. % | ||
| Fiji I | 351 43 | 195 24 | 110 14 | 88 11 | 68 8 | 1 {0.1} | 813 |
| Interior | 54 35 | 56 37 | 13 8 | 15 10 | 15 10 | 0 0 | 153 |
| East | 49 41 | 33 28 | 15 13 | 12 10 | 11 9 | 0 0 | 120 |
| Coast | 84 40 | 51 24 | 36 17 | 18 9 | 19 9 | 1 1 | 209 |
| N.W. | 39 49 | 19 24 | 11 14 | 6 8 | 4 5 | 0 0 | 79 |
Variations in body build have been expressed with the Sheldon method of somatotyping.[18] Accordingly, the Fijians are primarily and definitely mesomorphic, with endomorphy the second strongest component, and ectomorphy, third. About 80 per cent of the total series had a mesomorphic rating of 5 and 6 which leaves no doubt as to the prevailingly athletic physique. Endomorphy is seldom pronounced so that obesity may be described as no more than occasional. A pronounced linear build is likewise relatively infrequent.
The Fijian subgroups do not vary markedly from the over-all pattern.
SUMMARY
The preceding data may be summarized from three points of view. The first will emphasize the physical features that are common to most Fijians. At the outset it should be pointed out that a "typical" Fijian does not exist, except as a statistical abstraction. The racial composition of the Fijian is complex and far from being homogeneous. There is no doubt, from the physical and cultural evidence, as well as the geographical location, that Fijians are related to both Melanesians and Polynesians. The second point is to give a precise indication of these affinities with Melanesia and Polynesia. A third concern of this analysis is the geographical variability within Fiji. This consists of a regional breakdown of the Fijian data into interior, eastern, coastal, and northwestern divisions, in order to demonstrate some of the local variation of the Melanesian-Polynesian ingredients and their possible meaning.
Body (pl. 1).
—In general size and appearance, the Fijian is tall and well proportioned. His body is fairly tall and well muscled, that is, predominately athletic in build. Obesity is relatively uncommon except in moderate degrees. This rather tall stature allies the Fijians more closely with the Polynesians. Shoulder, chest, and hip diameters also indicate that Fijians are generously endowed.
The Fijians who occupy the mountainous interior of the main island are less tall than the coastal and eastern people; they also have narrower shoulders, relatively deeper and narrower chests, whereas their arms and legs are somewhat shorter. The eastern Fijians are tallest of all subgroups.
Skin Color.
—Most Fijians have either medium- or dark-brown skin on the exposed facial surfaces. The more protected body areas show higher frequencies of medium brown and light brown. The Fijians are definitely less dark than the Melanesians but are darker, on the whole, than the Polynesians.
The interior hill tribes are darker than the eastern and coastal groups. The lightest average skin shade occurs in the east.
Hair (pls. 6 and 7).
—In several respects the hair is the most consistent endowment of the Fijians. In nearly all instances it is black, frizzly, and coarse. The only departure from this condition is an occasional instance of dark brown and a few instances of rufous shade. Curly hair is a more common exception in the east. The coastal and northwestern people are nearer to the interior condition of frizzly hair. All in all, the hair form is definitely Melanesian. Hair length [Pg 23] conforms to the general Melanesian condition, that is, intermediate between short Negroid and long Caucasiod or Mongoloid.
Considerable beard and body hair is common to Fijians (pls. 8 and 9). Moderate to pronounced beard is shown by nearly three-quarters of the total series, and body hair is even more prevelant. General hairiness is also exhibited by the Solomon Islanders and the Tongans in the comparative data. The interior tribes of Fiji are more hairy than the other groups. This prevelence of body and face hair seems to conform to parts of Melanesia where it may be regarded as an Australoid element. Its presence in the Tongan data does not seem to be representative of other Polynesians, who are generally described as more glabrous.
Head (pl. 2).
—Moderate brachycephaly is the commonest head form of Fijians, although the total range is great. In this respect the Fijians resemble the broad-headed Tongans, and are quite distinct from the longer-headed Melanesians. The Fijian head, despite its general brachycephaly, is rather compressed in the temporal area and submedium in parietal elevation. The back of the cranium is characteristically flattened, a natural conformation as no deformation is practiced.
The interior mountain tribes of Fiji have narrower heads and lower cranial indices than do the coastal and eastern groups. The interior people also have lesser head heights and a higher breadth-height index.
Forehead (pl. 10).
—Moderate to strongly developed supraorbital ridges are a common Fijian endowment. Similarly are low and sloping foreheads. These features have been observed in western Melanesia, where, like hairiness, they suggest Australoid of archaic Caucasoid elements.
Face.
—Broadness characterizes the Fijian face. Bizygomatic breadth locates them nearer to the Polynesians than to the narrower-faced Melanesians. Strongly developed malars are common, and they tend to project laterally more than frontally. Widest faces appear among the eastern people.
Bigonial and bicanine widths show that generous breadth includes the lower parts of the face, a condition born out by strong gonial angles.
Face length falls between the long-faced Tongans and the definitely shorter-faced Melanesians (pls. 3 and 4).
Some prognathism is common among Fijians, both total and mid-facial, but the condition is not universal nor pronounced. The eastern Fijians are the least prognathic (pl. 10).
Eyes.
—Dark brown is the prevailing eye color, although many subjects have medium-brown eyes. Eye folds are only occasional and eye-opening height is usually moderate. Slight eye obliquity is common, more so in the eastern sample.
Nose (pl. 4).
—Great variability marks the nasal area. The commonest condition is a broad and moderately long nose. Medium nasion depression is frequent; the root is wide and moderately elevated. Bridge breadth is often pronounced and the nasal profile is straight to convex. The nasal tip is characteristically thickened and nasal wings are usually flaring. On the whole, there is a great deal of Melanesian in the Fijian nose; it is Negroid, but not pronouncedly. Those aspects of the nose which may be termed Negroid are commoner in the interior hill people and the northwest and least evident in the east.
Lips (pl. 5).
—Thick and moderately everted lips occur in nearly half the series. This Negroid combination is more manifest in the interior and least in the east. Integumental lips tend to be heavy.
Teeth.
—The condition of the teeth is generally excellent. Most Fijians have broad, roomy jaws that permit complete and uncrowded tooth development. Dental caries are very infrequent. A rather high incidence of edge-to-edge bite is interesting.
Ears (pl. 5).
—The ears are usually moderate in length and tend to protrude. Ear lobes are commonly large and are more often attached or soldered than free.
CONCLUSIONS
On the whole the Fijians are predominately Melanesian but with numerous Polynesian affinities that vary with locality. The Melanesian qualities are in part Negroid or Negritoid and in part Australoid. The Negroid resemblances are best illustrated by frizzly black hair, broad noses with depressed nasion and flaring nostrils, thick lips, and dark pigmentation (pls. 11 and 12). Australoid elements are general hairiness, strong brow ridges, low, sloping foreheads, compressed parietal and temporal areas, and some prognathism (pl. 13). The presence of Australoid suggestions need not mean that they come from Australia, but that they form a part of the Melanesian make-up. This interpretation of the Melanesians as a hybrid people conforms with similar designations by such students as Birdsell[19] and Hooton.[20] Polynesian influence in Fiji is most clearly demonstrated by lighter pigmentation, tall and muscular body build, moderate brachycephaly, broad faces and jaws, high and fairly long noses and strong chins. I found much the same resemblances between Fijians and Polynesians as did Howells;[21] however, in my comparisons the Polynesian similarities are outweighed and outnumbered by a greater array of Melanesian characters. The essential Melanesian character of the Fijian population is further demonstrated by recent blood-analysis comparisons; the conclusions of Simmons et al., identify the Fijians as Melanesian.[22]
The Fijians who live in the interior of Viti Levu show the most frequent Melanesian traits (pls. 11 and 14). These people are shorter, have narrower shoulders and chests; their heads are narrower and lower vaulted; they have broader noses, thicker lips, are hairier, and have darker skins. This condition, occurring as it does in the mountainous interior, which may be regarded as a refuge area, supports the theory that the Melanesian is the earlier component in Fiji.
The eastern Fijians stand in considerable contrast to the interior tribes and are the most Polynesian in appearance (pl. 15). They have lighter skins, greater stature, and heavier musculature. Their heads are broader, as are their faces and jaws; their noses are larger, narrower, and higher bridged, and their chins are more pronounced.
The coastal sample might be called intermediate or a more even blend of Melanesian and Polynesian.
The northwestern people resemble the coastal tribes. This means they show fewer departures in either a Melanesian or Polynesian direction. This also means they do not tell us whether the legendary ancestors, who are supposed to have first landed in Fiji on the northwest coast of Viti Levu,[23] were Melanesian or Polynesian. These data may mean one of three things: (1) the Fijian tradition of a landing at this place eight or ten generations ago is groundless, (2) the immigration did take place but whatever racial traits predominated, whether Melanesian or Polynesian, have been homogenized and obscured by subsequent intermixture and by movements back and forth on Viti Levu, (3) the landing did occur but the ancestors were already a Melanesian-Polynesian blend when they arrived.
LITERATURE CITED
Birdsell. J. B.
1948. Racial Origin of the Extinct Tasmanians. Records of the Queen
Victoria Museum, Tasmania, Vol. II, No. 3.
Churchill, W.
1911. The Polynesian Wanderings. Carnegie Institute of Washington,
Publ. No. 134, Washington.
Derrick, R. A.
1951. History of Fiji. Printing and Stationery Dept., Suva, Fiji.
Fornander, A.
1878. The Polynesian Race. London.
Hocart, A. M.
1929. Lau Islands, Fiji. Bernice P. Bishop Museum, Bull. 62,
Honolulu.
Hooton, E. A.
1946. Up From the Ape. Macmillan Co., New York
Howells. W. W.
1933. Anthropometry and Blood Types in Fiji and the Solomon Islands.
American Museum of Natural History. Anthropological Papers, Vol. 33,
Pt. 4.
Roth, G. K.
1953. The Fijian Way of Life. Oxford University Press, London.
Simmon, R. T., J. J. Graydon, and G. Barnes
1945. The Medical Journal of Australia, May 26.
Sullivan, L. R.
1922. A Contribution to Tongan Somotology. Bernice P. Bishop Museum,
Vol. VIII, No. 4.
Thomson, B.
1908. The Fijians: A Study of the Decay of Custom. Wm. Heinemann,
London.
PLATES
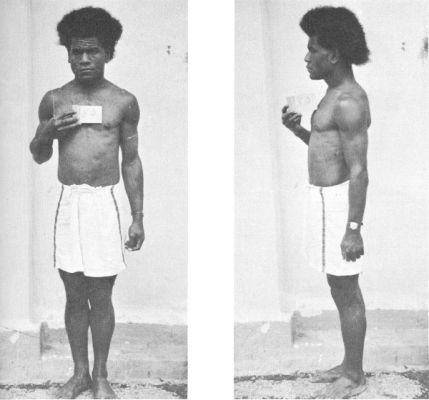
PLATE 1. NEAR-AVERAGE BODY FEATURES
| Stature: 173.3 cm. |
| Weight: 172.1 lbs. |
| Arm length: 75.1 cm. |
| Leg length: 82.2 cm. |
| Shoulder breadth: 41 cm. |
| Hip breadth: 29.1 cm. |
| Shoulder-hip index: 71.0 |
| Chest breadth: 28.8 cm. |
| Chest depth: 22.8 cm. |
| Thoracic index: 75.7 |
| Sitting height: 86.3 cm. |
| Sitting height-stature index: 50.0 |
| Body build: Strongly mesomorphic |
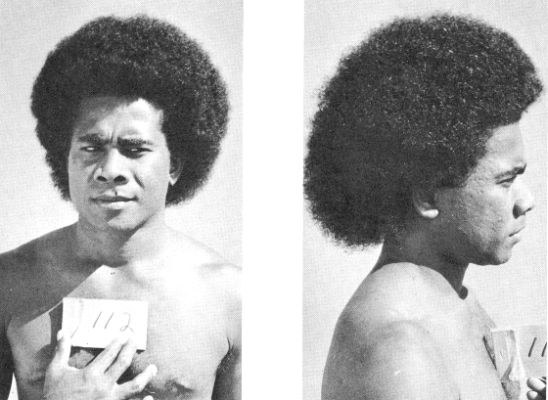
PLATE 2. NEAR-AVERAGE CRANIAL FEATURES
| Head length: 187.2 mm. |
| Head breadth: 156.9 mm. |
| Cephalic index: 83.9 |
| Head height: 128.6 mm. |
| Length-height index: 68.7 |
| Length-breadth index: 81.1 |
| Minimum frontal diameter: 109.8 mm. |
| Fronto-parietal index: 70.0 |
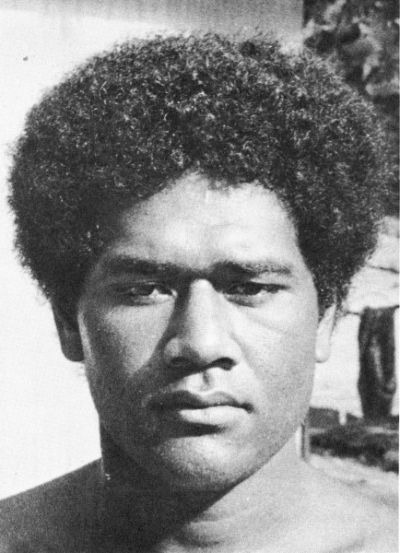
PLATE 3. NEAR-AVERAGE FACIAL FEATURES
| Bizygomatic breadth: 146.7 mm. |
| Cephalo-facial index: 93.2 |
| Zygo-frontal index: 75.3 |
| Bigonial breadth: 109.6 mm. |
| Fronto-gonial index: 100.1 |
| Zygo-gonial index: 74.7 |
| Bicanine breadth: 39.8 |
| Total facial height: 122.3 mm. |
| Total facial index: 84.1 |
| Upper facial height: 71.3 |
| Upper facial index: 48.9 |
| Nasal height: 53.1 |
| Nasal breadth: 45.5 |
| Nasal index: 85.6 |
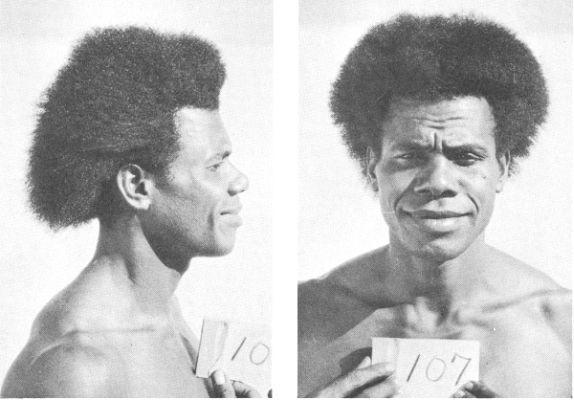
PLATE 4. NEAR-AVERAGE FACE AND NOSE FEATURES
| FACE |
| Pronounced malars |
| Moderately long face |
| Wide gonia |
| Moderate chin |
| Moderate prognathism |
| NOSE |
| Broad bridge |
| Wide root |
| Moderate length |
| Thick tip |
| Flaring nostrils |
| Straight profile |
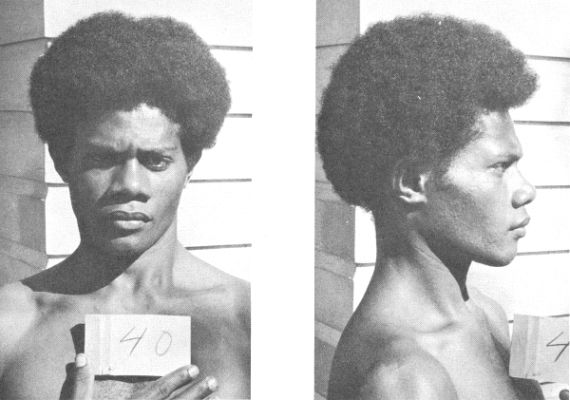
PLATE 5. NEAR-AVERAGE LIP AND EAR FEATURES
| LIPS |
| Moderately thick |
| Pronounced lip seam |
| Moderate eversion |
| EARS |
| Moderate size |
| Small lobe |
| Attached lobe |
| Moderate protrusion |
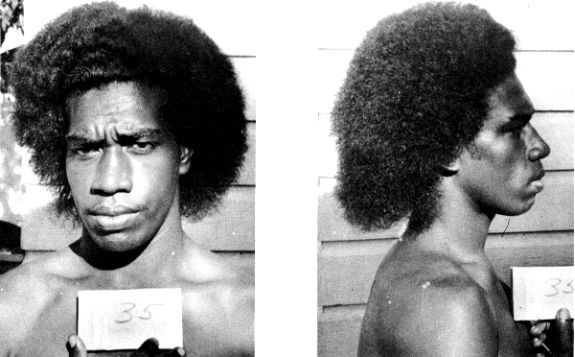
PLATE 6. NEAR-AVERAGE HAIR FEATURES
| Black color |
| Frizzly form |
| Pronounced quantity |
| Coarse texture |
| Intermediate length |
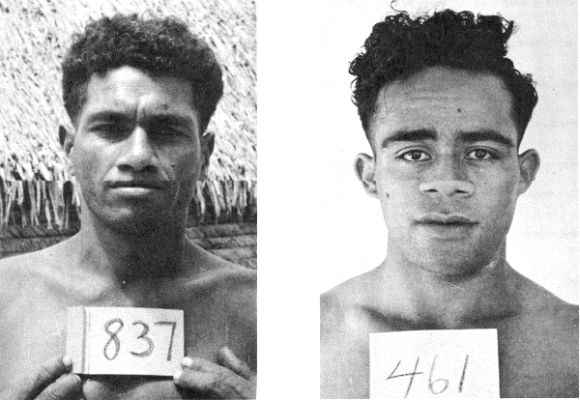
PLATE 7. HAIR FORM VARIANTS
CURLY HAIR WAVY HAIR
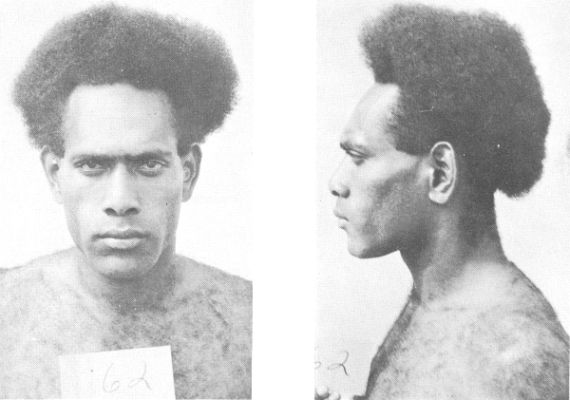
PLATE 8. PRONOUNCED BODY HAIR
| 20 per cent occurrence |
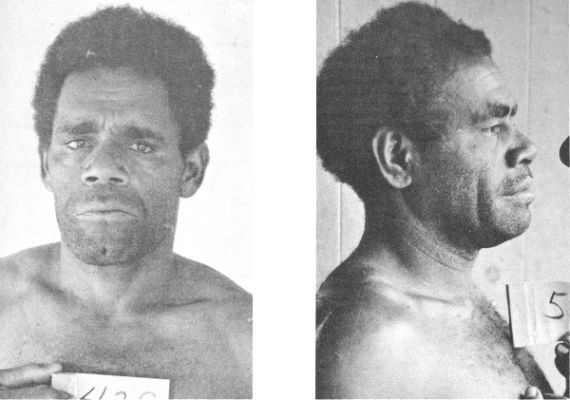
PLATE 9. PRONOUNCED BEARD
| 26 per cent occurrence |
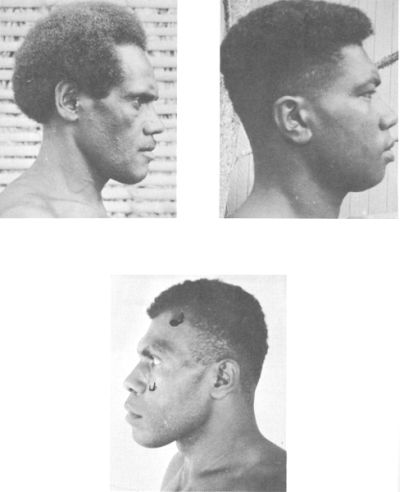
PLATE 10. FACIAL VARIATIONS
| No prognathism |
| High forehead |
| Moderate browridges |
| Moderate prognathism |
| Low, receding forehead |
| Pronounced browridges |
| Pronounced prognathism |
| Low, receding forehead |
| Very pronounced browridges |
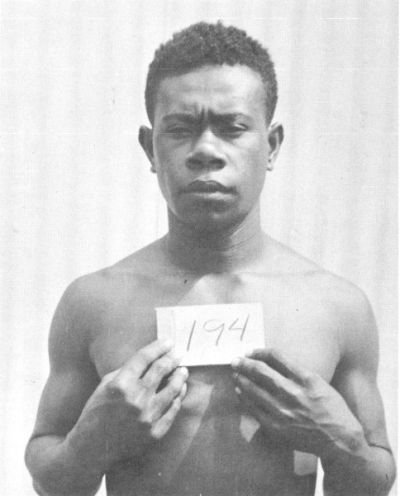
PLATE 11. INTERIOR SUBJECT (MORE NEGROID)
| Shorter stature |
| Narrower shoulders |
| Deeper chest |
| Darker skin |
| Narrower head |
| Broader nose |
| Thicker lips |
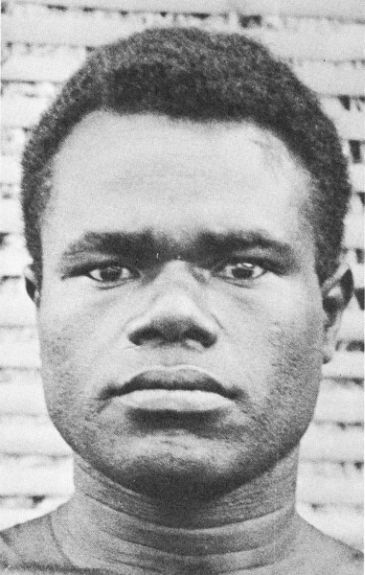
PLATE 12. "NEGROID" FIJIAN
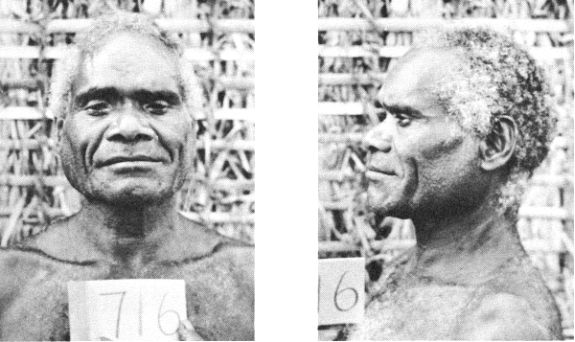
PLATE 13. INTERIOR SUBJECT (MORE AUSTRALOID)
| Heavier beard and body hair |
| Lower, more sloping forehead |
| More compressed parietals |
| More pronounced brow ridges |
| More prognathic |
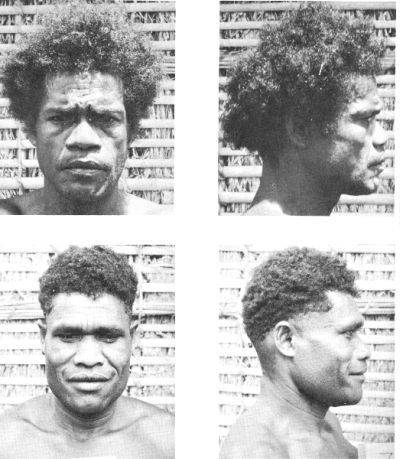
PLATE 14. "AUSTRALOID" FIJIANS
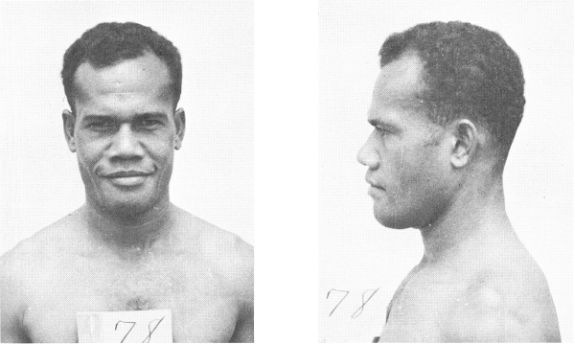
PLATE 15. EASTERN SUBJECT (MORE POLYNESIAN)
| Lighter skin |
| Less beard and body hair |
| Wavy hair |
| Wider head |
| Higher, steeper forehead |
| Less prognathic |
| Higher, narrower nose |
| Moderately thick lips |
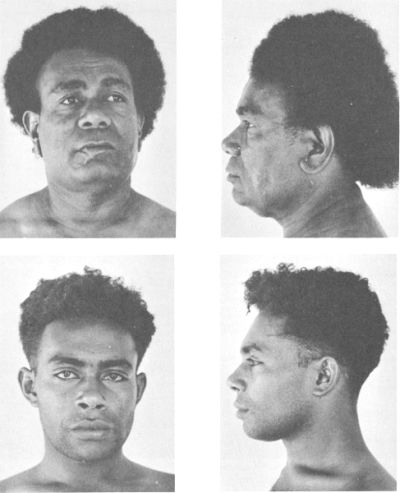
Illustration: PLATE 16. "POLYNESIAN" FIJIANS
[1] Hooton, 1946, pp. 735-763.
[2] Derrick, 1946, pp. 5-6.
[3] Ibid., pp. 7-8.
[4] Population statistics from "Fiji Information," of 1954, issued by Public Relations Office, Suva, Fiji.
[5] Hooton, 1946, p. 621.
[6] Birdsell, 1949, p. 120.
[7] Fornander, 1878.
[8] Churchill, 1911.
[9] Hocart, 1929, p. 236.
[10] Howells, 1933, p. 335.
[11] Roth, 1953, pp. 54, 55.
[12] One pound deducted for dress (usually shorts only).
[13] By subtracting sitting height from total stature.
[14] Cranial measurements are not distorted by cradling practice or other causes of deformation.
[15] Howells records skin color with the von Luschan scale. I have adjusted this scale to my own.
[16] + means medium or moderate; ++ means pronounced; +++ means very pronounced.
[17] Observation taken on the chest.
[18] W. H. Sheldon, The Variation of Human Physique, Harper and Bros., 1940.
[19] Birdsell, 1949, p. 120.
[20] Hooton, 1946, p. 621.
[21] Howells, 1933, p. 332.
[22] Simmons et al., 1945, pp. 3-4
[23] See pp. 1 and 4 of Introduction.
[Transcriber's Note: Figures incorrectly entered as zero have been calculated and inserted in {}.]
