
.
Papua New Guinea
Papua New Guinea
Papua New Guinea (East & Southeast Asia)
Introduction :: Papua New Guinea
Background: This entry usually highlights major historic events and current issues and may include a statement about one or two key future trends. Background field listing
The eastern half of the island of New Guinea - second largest in the world - was divided between Germany (north) and the UK (south) in 1885. The latter area was transferred to Australia in 1902, which occupied the northern portion during World War I and continued to administer the combined areas until independence in 1975. A nine-year secessionist revolt on the island of Bougainville ended in 1997 after claiming some 20,000 lives. Since 2001, Bougainville has experienced autonomy; a referendum asking the population if they would like independence or greater self rule occurred in November 2019, with almost 98% of voters choosing independence.
Geography :: Papua New Guinea
Location: This entry identifies the country's regional location, neighboring countries, and adjacent bodies of water. Location field listing
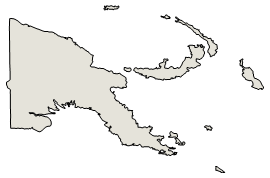
Oceania, group of islands including the eastern half of the island of New Guinea between the Coral Sea and the South Pacific Ocean, east of Indonesia
Geographic coordinates: This entry includes rounded latitude and longitude figures for the centroid or center point of a country expressed in degrees and minutes; it is based on the locations provided in the Geographic Names Server (GNS), maintained by the National Geospatial-Intelligence Agency on behalf of the US Board on Geographic Names. Geographic coordinates field listing
6 00 S, 147 00 E
Map references: This entry includes the name of the Factbook reference map on which a country may be found. Note that boundary representations on these maps are not necessarily authoritative. The entry on Geographic coordinates may be helpful in finding some smaller countries. Map references field listing
Oceania
Area: This entry includes three subfields. Total area is the sum of all land and water areas delimited by international boundaries and/or coastlines. Land area is the aggregate of all surfaces delimited by international boundaries and/or coastlines, excluding inland water bodies (lakes, reservoirs, rivers). Water area is the sum of the surfaces of all inland water bodies, such as lakes, reservoirs, or rivers, as delimited by international boundaries and/or coastlines. Area field listing
total: 462,840 sq km
land: 452,860 sq km
water: 9,980 sq km
country comparison to the world: 56
Area - comparative: This entry provides an area comparison based on total area equivalents. Most entities are compared with the entire US or one of the 50 states based on area measurements (1990 revised) provided by the US Bureau of the Census. The smaller entities are compared with Washington, DC (178 sq km, 69 sq mi) or The Mall in Washington, DC (0.59 sq km, 0.23 sq mi, 146 acres). Area - comparative field listing
slightly larger than California
Area comparison map: Area comparison map
Land boundaries: This entry contains the total length of all land boundaries and the individual lengths for each of the contiguous border countries. When available, official lengths published by national statistical agencies are used. Because surveying methods may differ, country border lengths reported by contiguous countries may differ. Land boundaries field listing
total: 824 km
border countries (1): Indonesia 824 km
Coastline: This entry gives the total length of the boundary between the land area (including islands) and the sea. Coastline field listing
5,152 km
Maritime claims: This entry includes the following claims, the definitions of which are excerpted from the United Nations Convention on the Law of the Sea (UNCLOS), which alone contains the full and definitive descriptions: territorial sea - the sovereignty of a coastal state extends beyond its land territory and internal waters to an adjacent belt of sea, described as the territorial sea in the UNCLOS (Part II); this sovereignty extends to the air space over the territorial sea as well as its underlying s . . . more Maritime claims field listing
territorial sea: 12 nm
continental shelf: 200-m depth or to the depth of exploitation
exclusive fishing zone: 200 nm
measured from claimed archipelagic baselines
Climate: This entry includes a brief description of typical weather regimes throughout the year; in the Word entry only, it includes four subfields that describe climate extremes:ten driest places on earth (average annual precipitation) describes the annual average precipitation measured in both millimeters and inches for selected countries with climate extremes. ten wettest places on earth (average annual precipitation) describes the annual average precipitation measured in both millimeters and i . . . more Climate field listing
tropical; northwest monsoon (December to March), southeast monsoon (May to October); slight seasonal temperature variation
Terrain: This entry contains a brief description of the topography. Terrain field listing
mostly mountains with coastal lowlands and rolling foothills
Elevation: This entry includes the mean elevation and elevation extremes, lowest point and highest point. Elevation field listing
mean elevation: 667 m
lowest point: Pacific Ocean 0 m
highest point: Mount Wilhelm 4,509 m
Natural resources: This entry lists a country's mineral, petroleum, hydropower, and other resources of commercial importance, such as rare earth elements (REEs). In general, products appear only if they make a significant contribution to the economy, or are likely to do so in the future. Natural resources field listing
gold, copper, silver, natural gas, timber, oil, fisheries
Land use: This entry contains the percentage shares of total land area for three different types of land use: agricultural land, forest, and other; agricultural land is further divided into arable land - land cultivated for crops like wheat, maize, and rice that are replanted after each harvest, permanent crops - land cultivated for crops like citrus, coffee, and rubber that are not replanted after each harvest, and includes land under flowering shrubs, fruit trees, nut trees, and vines, and permane . . . more Land use field listing
agricultural land: 2.6% (2011 est.)
arable land: 0.7% (2011 est.) / permanent crops: 1.5% (2011 est.) / permanent pasture: 0.4% (2011 est.)
forest: 63.1% (2011 est.)
other: 34.3% (2011 est.)
Irrigated land: This entry gives the number of square kilometers of land area that is artificially supplied with water. Irrigated land field listing
0 sq km (2012)
Population distribution: This entry provides a summary description of the population dispersion within a country. While it may suggest population density, it does not provide density figures. Population distribution field listing
population concentrated in the highlands and eastern coastal areas on the island of New Guinea; predominantly a rural distribution with only about one-fifth of the population residing in urban areas
Natural hazards: This entry lists potential natural disasters. For countries where volcanic activity is common, a volcanism subfield highlights historically active volcanoes. Natural hazards field listing
active volcanism; the country is subject to frequent and sometimes severe earthquakes; mud slides; tsunamis
volcanism: severe volcanic activity; Ulawun (2,334 m), one of Papua New Guinea's potentially most dangerous volcanoes, has been deemed a Decade Volcano by the International Association of Volcanology and Chemistry of the Earth's Interior, worthy of study due to its explosive history and close proximity to human populations; Rabaul (688 m) destroyed the city of Rabaul in 1937 and 1994; Lamington erupted in 1951 killing 3,000 people; Manam's 2004 eruption forced the island's abandonment; other historically active volcanoes include Bam, Bagana, Garbuna, Karkar, Langila, Lolobau, Long Island, Pago, St. Andrew Strait, Victory, and Waiowa; see note 2 under "Geography - note"
Environment - current issues: This entry lists the most pressing and important environmental problems. The following terms and abbreviations are used throughout the entry: Acidification - the lowering of soil and water pH due to acid precipitation and deposition usually through precipitation; this process disrupts ecosystem nutrient flows and may kill freshwater fish and plants dependent on more neutral or alkaline conditions (see acid rain). Acid rain - characterized as containing harmful levels of sulfur dioxi . . . more Environment - current issues field listing
rain forest loss as a result of growing commercial demand for tropical timber; unsustainable logging practices result in soil erosion, water quality degredation, and loss of habitat and biodiversity; large-scale mining projects cause adverse impacts on forests and water quality (discharge of heavy metals, cyanide, and acids into rivers); severe drought; inappropriate farming practices accelerate land degradion (soil erosion, siltation, loss of soil fertility); destructive fishing practices and coastal pollution due to run-off from land-based activities and oil spills
Environment - international agreements: This entry separates country participation in international environmental agreements into two levels - party to and signed, but not ratified. Agreements are listed in alphabetical order by the abbreviated form of the full name. Environment - international agreements field listing
party to: Antarctic Treaty, Biodiversity, Climate Change, Climate Change-Kyoto Protocol, Desertification, Endangered Species, Environmental Modification, Hazardous Wastes, Law of the Sea, Marine Dumping, Ozone Layer Protection, Ship Pollution, Tropical Timber 83, Tropical Timber 94, Wetlands
signed, but not ratified: none of the selected agreements
Geography - note: This entry includes miscellaneous geographic information of significance not included elsewhere. Geography - note field listing
note 1: shares island of New Guinea with Indonesia; generally east-west trending highlands break up New Guinea into diverse ecoregions; one of world's largest swamps along southwest coast
note 2: Papua New Guinea is one of the countries along the Ring of Fire, a belt of active volcanoes and earthquake epicenters bordering the Pacific Ocean; up to 90% of the world's earthquakes and some 75% of the world's volcanoes occur within the Ring of Fire
People and Society :: Papua New Guinea
Population: This entry gives an estimate from the US Bureau of the Census based on statistics from population censuses, vital statistics registration systems, or sample surveys pertaining to the recent past and on assumptions about future trends. The total population presents one overall measure of the potential impact of the country on the world and within its region. Note: Starting with the 1993 Factbook, demographic estimates for some countries (mostly African) have explicitly taken into account t . . . more Population field listing
7,259,456 (July 2020 est.)
country comparison to the world: 102
Nationality: This entry provides the identifying terms for citizens - noun and adjective. Nationality field listing
noun: Papua New Guinean(s)
adjective: Papua New Guinean
Ethnic groups: This entry provides an ordered listing of ethnic groups starting with the largest and normally includes the percent of total population. Ethnic groups field listing
Melanesian, Papuan, Negrito, Micronesian, Polynesian
Languages: This entry provides a listing of languages spoken in each country and specifies any that are official national or regional languages. When data is available, the languages spoken in each country are broken down according to the percent of the total population speaking each language as a first language. For those countries without available data, languages are listed in rank order based on prevalence, starting with the most-spoken language. Languages field listing
Tok Pisin (official), English (official), Hiri Motu (official), some 839 indigenous languages spoken (about 12% of the world's total); many languages have fewer than 1,000 speakers
note: Tok Pisin, a creole language, is widely used and understood; English is spoken by 1%-2%; Hiri Motu is spoken by less than 2%
Religions: This entry is an ordered listing of religions by adherents starting with the largest group and sometimes includes the percent of total population. The core characteristics and beliefs of the world's major religions are described below. Baha'i - Founded by Mirza Husayn-Ali (known as Baha'u'llah) in Iran in 1852, Baha'i faith emphasizes monotheism and believes in one eternal transcendent God. Its guiding focus is to encourage the unity of all peoples on the earth so that justice and peace m . . . more Religions field listing
Protestant 64.3% (Evangelical Lutheran 18.4%, Seventh Day Adventist 12.9%, Pentecostal 10.4%, United Church 10.3%, Evangelical Alliance 5.9%, Anglican 3.2%, Baptist 2.8%, Salvation Army .4%), Roman Catholic 26%, other Christian 5.3%, non-Christian 1.4%, unspecified 3.1% (2011 est.)
note: data represent only the citizen population; roughly .3% of the population are non-citizens, consisting of Christian 52% (predominantly Roman Catholic), other 10.7% , none 37.3%
Age structure: This entry provides the distribution of the population according to age. Information is included by sex and age group as follows: 0-14 years (children), 15-24 years (early working age), 25-54 years (prime working age), 55-64 years (mature working age), 65 years and over (elderly). The age structure of a population affects a nation's key socioeconomic issues. Countries with young populations (high percentage under age 15) need to invest more in schools, while countries with older population . . . more Age structure field listing
0-14 years: 31.98% (male 1,182,539/female 1,139,358)
15-24 years: 19.87% (male 731,453/female 711,164)
25-54 years: 37.68% (male 1,397,903/female 1,337,143)
55-64 years: 5.83% (male 218,529/female 204,717)
65 years and over: 4.64% (male 164,734/female 171,916) (2020 est.)
population pyramid: population pyramid
Dependency ratios: Dependency ratios are a measure of the age structure of a population. They relate the number of individuals that are likely to be economically "dependent" on the support of others. Dependency ratios contrast the ratio of youths (ages 0-14) and the elderly (ages 65+) to the number of those in the working-age group (ages 15-64). Changes in the dependency ratio provide an indication of potential social support requirements resulting from changes in population age structures. As fertility leve . . . more Dependency ratios field listing
total dependency ratio: 63.2
youth dependency ratio: 57.4
elderly dependency ratio: 5.8
potential support ratio: 17.2 (2020 est.)
Median age: This entry is the age that divides a population into two numerically equal groups; that is, half the people are younger than this age and half are older. It is a single index that summarizes the age distribution of a population. Currently, the median age ranges from a low of about 15 in Niger and Uganda to 40 or more in several European countries and Japan. See the entry for "Age structure" for the importance of a young versus an older age structure and, by implication, a low versus a high . . . more Median age field listing
total: 24 years
male: 24 years
female: 24 years (2020 est.)
country comparison to the world: 171
Population growth rate: The average annual percent change in the population, resulting from a surplus (or deficit) of births over deaths and the balance of migrants entering and leaving a country. The rate may be positive or negative. The growth rate is a factor in determining how great a burden would be imposed on a country by the changing needs of its people for infrastructure (e.g., schools, hospitals, housing, roads), resources (e.g., food, water, electricity), and jobs. Rapid population growth can be seen as . . . more Population growth rate field listing
1.6% (2020 est.)
country comparison to the world: 63
Birth rate: This entry gives the average annual number of births during a year per 1,000 persons in the population at midyear; also known as crude birth rate. The birth rate is usually the dominant factor in determining the rate of population growth. It depends on both the level of fertility and the age structure of the population. Birth rate field listing
22.5 births/1,000 population (2020 est.)
country comparison to the world: 63
Death rate: This entry gives the average annual number of deaths during a year per 1,000 population at midyear; also known as crude death rate. The death rate, while only a rough indicator of the mortality situation in a country, accurately indicates the current mortality impact on population growth. This indicator is significantly affected by age distribution, and most countries will eventually show a rise in the overall death rate, in spite of continued decline in mortality at all ages, as declining . . . more Death rate field listing
6.7 deaths/1,000 population (2020 est.)
country comparison to the world: 137
Net migration rate: This entry includes the figure for the difference between the number of persons entering and leaving a country during the year per 1,000 persons (based on midyear population). An excess of persons entering the country is referred to as net immigration (e.g., 3.56 migrants/1,000 population); an excess of persons leaving the country as net emigration (e.g., -9.26 migrants/1,000 population). The net migration rate indicates the contribution of migration to the overall level of population chan . . . more Net migration rate field listing
0 migrant(s)/1,000 population (2020 est.)
country comparison to the world: 93
Population distribution: This entry provides a summary description of the population dispersion within a country. While it may suggest population density, it does not provide density figures. Population distribution field listing
population concentrated in the highlands and eastern coastal areas on the island of New Guinea; predominantly a rural distribution with only about one-fifth of the population residing in urban areas
Urbanization: This entry provides two measures of the degree of urbanization of a population. The first, urban population, describes the percentage of the total population living in urban areas, as defined by the country. The second, rate of urbanization, describes the projected average rate of change of the size of the urban population over the given period of time. It is possible for a country with a 100% urban population to still display a change in the rate of urbanization (up or down). For example . . . more Urbanization field listing
urban population: 13.3% of total population (2020)
rate of urbanization: 2.51% annual rate of change (2015-20 est.)
Major urban areas - population: This entry provides the population of the capital and up to six major cities defined as urban agglomerations with populations of at least 750,000 people. An urban agglomeration is defined as comprising the city or town proper and also the suburban fringe or thickly settled territory lying outside of, but adjacent to, the boundaries of the city. For smaller countries, lacking urban centers of 750,000 or more, only the population of the capital is presented. Major urban areas - population field listing
383,000 PORT MORESBY (capital) (2020)
Sex ratio: This entry includes the number of males for each female in five age groups - at birth, under 15 years, 15-64 years, 65 years and over, and for the total population. Sex ratio at birth has recently emerged as an indicator of certain kinds of sex discrimination in some countries. For instance, high sex ratios at birth in some Asian countries are now attributed to sex-selective abortion and infanticide due to a strong preference for sons. This will affect future marriage patterns and fertilit . . . more Sex ratio field listing
at birth: 1.05 male(s)/female
0-14 years: 1.04 male(s)/female
15-24 years: 1.03 male(s)/female
25-54 years: 1.05 male(s)/female
55-64 years: 1.07 male(s)/female
65 years and over: 0.96 male(s)/female
total population: 1.04 male(s)/female (2020 est.)
Maternal mortality rate: The maternal mortality rate (MMR) is the annual number of female deaths per 100,000 live births from any cause related to or aggravated by pregnancy or its management (excluding accidental or incidental causes). The MMR includes deaths during pregnancy, childbirth, or within 42 days of termination of pregnancy, irrespective of the duration and site of the pregnancy, for a specified year. Maternal mortality rate field listing
145 deaths/100,000 live births (2017 est.)
country comparison to the world: 58
Infant mortality rate: This entry gives the number of deaths of infants under one year old in a given year per 1,000 live births in the same year. This rate is often used as an indicator of the level of health in a country. Infant mortality rate field listing
total: 33.2 deaths/1,000 live births
male: 36.4 deaths/1,000 live births
female: 29.8 deaths/1,000 live births (2020 est.)
country comparison to the world: 46
Life expectancy at birth: This entry contains the average number of years to be lived by a group of people born in the same year, if mortality at each age remains constant in the future. Life expectancy at birth is also a measure of overall quality of life in a country and summarizes the mortality at all ages. It can also be thought of as indicating the potential return on investment in human capital and is necessary for the calculation of various actuarial measures. Life expectancy at birth field listing
total population: 67.8 years
male: 65.6 years
female: 70 years (2020 est.)
country comparison to the world: 179
Total fertility rate: This entry gives a figure for the average number of children that would be born per woman if all women lived to the end of their childbearing years and bore children according to a given fertility rate at each age. The total fertility rate (TFR) is a more direct measure of the level of fertility than the crude birth rate, since it refers to births per woman. This indicator shows the potential for population change in the country. A rate of two children per woman is considered the replaceme . . . more Total fertility rate field listing
2.84 children born/woman (2020 est.)
country comparison to the world: 60
Drinking water source: This entry provides information about access to improved or unimproved drinking water sources available to segments of the population of a country. Improved drinking water - use of any of the following sources: piped water into dwelling, yard, or plot; public tap or standpipe; tubewell or borehole; protected dug well; protected spring; or rainwater collection. Unimproved drinking water - use of any of the following sources: unprotected dug well; unprotected spring; cart with small tank or . . . more Drinking water source field listing
improved: urban: 88% of population
rural: 32.8% of population
total: 40% of population
unimproved: urban: 12% of population
rural: 67.2% of population
total: 60% of population (2015 est.)
Current Health Expenditure: Current Health Expenditure (CHE) describes the share of spending on health in each country relative to the size of its economy. It includes expenditures corresponding to the final consumption of health care goods and services and excludes investment, exports, and intermediate consumption. CHE shows the importance of the health sector in the economy and indicates the priority given to health in monetary terms. Note: Current Health Expenditure replaces the former Health Expenditures field . . . more Current Health Expenditure field listing
2.5% (2017)
Physicians density: This entry gives the number of medical doctors (physicians), including generalist and specialist medical practitioners, per 1,000 of the population. Medical doctors are defined as doctors that study, diagnose, treat, and prevent illness, disease, injury, and other physical and mental impairments in humans through the application of modern medicine. They also plan, supervise, and evaluate care and treatment plans by other health care providers. The World Health Organization estimates that f . . . more Physicians density field listing
0.05 physicians/1,000 population (2010)
Sanitation facility access: This entry provides information about access to improved or unimproved sanitation facilities available to segments of the population of a country. Improved sanitation - use of any of the following facilities: flush or pour-flush to a piped sewer system, septic tank or pit latrine; ventilated improved pit (VIP) latrine; pit latrine with slab; or a composting toilet. Unimproved sanitation - use of any of the following facilities: flush or pour-flush not piped to a sewer system, septic tank . . . more Sanitation facility access field listing
improved: urban: 56.4% of population (2015 est.)
rural: 13.3% of population (2015 est.)
total: 18.9% of population (2015 est.)
unimproved: urban: 43.6% of population (2015 est.)
rural: 86.7% of population (2015 est.)
total: 81.1% of population (2015 est.)
HIV/AIDS - adult prevalence rate: This entry gives an estimate of the percentage of adults (aged 15-49) living with HIV/AIDS. The adult prevalence rate is calculated by dividing the estimated number of adults living with HIV/AIDS at yearend by the total adult population at yearend. HIV/AIDS - adult prevalence rate field listing
0.8% (2018 est.)
country comparison to the world: 55
HIV/AIDS - people living with HIV/AIDS: This entry gives an estimate of all people (adults and children) alive at yearend with HIV infection, whether or not they have developed symptoms of AIDS. HIV/AIDS - people living with HIV/AIDS field listing
45,000 (2018 est.)
country comparison to the world: 62
HIV/AIDS - deaths: This entry gives an estimate of the number of adults and children who died of AIDS during a given calendar year. HIV/AIDS - deaths field listing
1,100 (2017 est.)
country comparison to the world: 60
Major infectious diseases: This entry lists major infectious diseases likely to be encountered in countries where the risk of such diseases is assessed to be very high as compared to the United States. These infectious diseases represent risks to US government personnel traveling to the specified country for a period of less than three years. The degree of risk is assessed by considering the foreign nature of these infectious diseases, their severity, and the probability of being affected by the diseases present. Th . . . more Major infectious diseases field listing
degree of risk: very high (2020)
food or waterborne diseases: bacterial diarrhea, hepatitis A, and typhoid fever
vectorborne diseases: dengue fever and malaria
Obesity - adult prevalence rate: This entry gives the percent of a country's population considered to be obese. Obesity is defined as an adult having a Body Mass Index (BMI) greater to or equal to 30.0. BMI is calculated by taking a person's weight in kg and dividing it by the person's squared height in meters. Obesity - adult prevalence rate field listing
21.3% (2016)
country comparison to the world: 91
Children under the age of 5 years underweight: This entry gives the percent of children under five considered to be underweight. Underweight means weight-for-age is approximately 2 kg below for standard at age one, 3 kg below standard for ages two and three, and 4 kg below standard for ages four and five. This statistic is an indicator of the nutritional status of a community. Children who suffer from growth retardation as a result of poor diets and/or recurrent infections tend to have a greater risk of suffering illness and death. Children under the age of 5 years underweight field listing
27.8% (2010)
country comparison to the world: 14
Education expenditures: This entry provides the public expenditure on education as a percent of GDP. Education expenditures field listing
NA
Literacy: This entry includes a definition of literacy and UNESCO's percentage estimates for populations aged 15 years and over, including total population, males, and females. There are no universal definitions and standards of literacy. Unless otherwise specified, all rates are based on the most common definition - the ability to read and write at a specified age. Detailing the standards that individual countries use to assess the ability to read and write is beyond the scope of the Factbook. Info . . . more Literacy field listing
definition: age 15 and over can read and write
total population: 64.2%
male: 65.6%
female: 62.8% (2015)
Unemployment, youth ages 15-24: This entry gives the percent of the total labor force ages 15-24 unemployed during a specified year. Unemployment, youth ages 15-24 field listing
total: 3.6%
male: 4.3%
female: 3% (2010 est.)
country comparison to the world: 172
People - note: This entry includes miscellaneous demographic information of significance not included elsewhere. People - note field listing
the indigenous population of Papua New Guinea (PNG) is one of the most heterogeneous in the world; PNG has several thousand separate communities, most with only a few hundred people; divided by language, customs, and tradition, some of these communities have engaged in low-scale tribal conflict with their neighbors for millennia; the advent of modern weapons and modern migrants into urban areas has greatly magnified the impact of this lawlessness
Government :: Papua New Guinea
Country name: This entry includes all forms of the country's name approved by the US Board on Geographic Names (Italy is used as an example): conventional long form (Italian Republic), conventional short form (Italy), local long form (Repubblica Italiana), local short form (Italia), former (Kingdom of Italy), as well as the abbreviation. Also see the Terminology note. Country name field listing
conventional long form: Independent State of Papua New Guinea
conventional short form: Papua New Guinea
local short form: Papuaniugini
former: Territory of Papua and New Guinea
abbreviation: PNG
etymology: the word "papua" derives from the Malay "papuah" describing the frizzy hair of the Melanesians; Spanish explorer Ynigo ORTIZ de RETEZ applied the term "Nueva Guinea" to the island of New Guinea in 1545 after noting the resemblance of the locals to the peoples of the Guinea coast of Africa
Government type: This entry gives the basic form of government. Definitions of the major governmental terms are as follows. (Note that for some countries more than one definition applies.): Absolute monarchy - a form of government where the monarch rules unhindered, i.e., without any laws, constitution, or legally organized opposition. Anarchy - a condition of lawlessness or political disorder brought about by the absence of governmental authority. Authoritarian - a form of government in whic . . . more Government type field listing
parliamentary democracy under a constitutional monarchy; a Commonwealth realm
Capital: This entry gives the name of the seat of government, its geographic coordinates, the time difference relative to Coordinated Universal Time (UTC) and the time observed in Washington, DC, and, if applicable, information on daylight saving time (DST). Where appropriate, a special note has been added to highlight those countries that have multiple time zones. Capital field listing
name: Port Moresby
geographic coordinates: 9 27 S, 147 11 E
time difference: UTC+10 (15 hours ahead of Washington, DC, during Standard Time)
note: Papua New Guinea has two time zones, including Bougainville (UTC+11)
etymology: named in 1873 by Captain John Moresby (1830-1922) in honor of his father, British Admiral Sir Fairfax Moresby (1786-1877)
Administrative divisions: This entry generally gives the numbers, designatory terms, and first-order administrative divisions as approved by the US Board on Geographic Names (BGN). Changes that have been reported but not yet acted on by the BGN are noted. Geographic names conform to spellings approved by the BGN with the exception of the omission of diacritical marks and special characters. Administrative divisions field listing
20 provinces, 1 autonomous region*, and 1 district**; Bougainville*, Central, Chimbu, Eastern Highlands, East New Britain, East Sepik, Enga, Gulf, Hela, Jiwaka, Madang, Manus, Milne Bay, Morobe, National Capital**, New Ireland, Northern, Southern Highlands, Western, Western Highlands, West New Britain, West Sepik
Independence: For most countries, this entry gives the date that sovereignty was achieved and from which nation, empire, or trusteeship. For the other countries, the date given may not represent "independence" in the strict sense, but rather some significant nationhood event such as the traditional founding date or the date of unification, federation, confederation, establishment, fundamental change in the form of government, or state succession. For a number of countries, the establishment of statehood . . . more Independence field listing
16 September 1975 (from the Australia-administered UN trusteeship)
National holiday: This entry gives the primary national day of celebration - usually independence day. National holiday field listing
Independence Day, 16 September (1975)
Constitution: This entry provides information on a country’s constitution and includes two subfields. The history subfield includes the dates of previous constitutions and the main steps and dates in formulating and implementing the latest constitution. For countries with 1-3 previous constitutions, the years are listed; for those with 4-9 previous, the entry is listed as “several previous,” and for those with 10 or more, the entry is “many previous.” The amendments subfield summarizes the process of am . . . more Constitution field listing
history: adopted 15 August 1975, effective at independence 16 September 1975
amendments: proposed by the National Parliament; passage has prescribed majority vote requirements depending on the constitutional sections being amended – absolute majority, two-thirds majority, or three-fourths majority; amended many times, last in 2014 (2018)
Legal system: This entry provides the description of a country's legal system. A statement on judicial review of legislative acts is also included for a number of countries. The legal systems of nearly all countries are generally modeled upon elements of five main types: civil law (including French law, the Napoleonic Code, Roman law, Roman-Dutch law, and Spanish law); common law (including United State law); customary law; mixed or pluralistic law; and religious law (including Islamic law). An addition . . . more Legal system field listing
mixed legal system of English common law and customary law
International law organization participation: This entry includes information on a country's acceptance of jurisdiction of the International Court of Justice (ICJ) and of the International Criminal Court (ICCt); 59 countries have accepted ICJ jurisdiction with reservations and 11 have accepted ICJ jurisdiction without reservations; 122 countries have accepted ICCt jurisdiction. Appendix B: International Organizations and Groups explains the differing mandates of the ICJ and ICCt. International law organization participation field listing
has not submitted an ICJ jurisdiction declaration; non-party state to the ICCt
Citizenship: This entry provides information related to the acquisition and exercise of citizenship; it includes four subfields: citizenship by birth describes the acquisition of citizenship based on place of birth, known as Jus soli, regardless of the citizenship of parents. citizenship by descent only describes the acquisition of citizenship based on the principle of Jus sanguinis, or by descent, where at least one parent is a citizen of the state and being born within the territorial limits of the s . . . more Citizenship field listing
citizenship by birth: no
citizenship by descent only: at least one parent must be a citizen of Papua New Guinea
dual citizenship recognized: no
residency requirement for naturalization: 8 years
Suffrage: This entry gives the age at enfranchisement and whether the right to vote is universal or restricted. Suffrage field listing
18 years of age; universal
Executive branch: This entry includes five subentries: chief of state; head of government; cabinet; elections/appointments; election results. Chief of state includes the name, title, and beginning date in office of the titular leader of the country who represents the state at official and ceremonial functions but may not be involved with the day-to-day activities of the government. Head of government includes the name, title of the top executive designated to manage the executive branch of the government, a . . . more Executive branch field listing
chief of state: Queen ELIZABETH II (since 6 February 1952); represented by Governor General Grand Chief Sir Bob DADAE (since 28 February 2017)
head of government: Prime Minister James MARAPE (since 30 May 2019); Deputy Prime Minister Charles ABEL (since 4 August 2017)
cabinet: National Executive Council appointed by the governor general on the recommendation of the prime minister
elections/appointments: the monarchy is hereditary; governor general nominated by the National Parliament and appointed by the chief of state; following legislative elections, the leader of the majority party or majority coalition usually appointed prime minister by the governor general pending the outcome of a National Parliament vote
election results: Peter Paire O'NEILL (PNC) reelected prime minister; National Parliament vote - 60 to 46
Legislative branch: This entry has three subfields. The description subfield provides the legislative structure (unicameral – single house; bicameral – an upper and a lower house); formal name(s); number of member seats; types of constituencies or voting districts (single seat, multi-seat, nationwide); electoral voting system(s); and member term of office. The elections subfield includes the dates of the last election and next election. The election results subfield lists percent of vote by party/coalition an . . . more Legislative branch field listing
description: unicameral National Parliament (111 seats; members directly elected in single-seat constituencies - 89 local, 20 provinicial, the autonomous province of Bouganville, and the National Capital District - by majority preferential vote; members serve 5-year terms); note - the constitution allows up to 126 seats
elections: last held from 24 June 2017 to 8 July 2017 (next to be held in June 2022)
election results: percent of vote by party - PNC 37%; NA 13%; Pangu 14%; URP 11%; PPP 4%; SDP 4%; Independents 3%; and smaller parties 14%; seats by party - NA; composition - men 108, women 3, percent of women 3%
Judicial branch: This entry includes three subfields. The highest court(s) subfield includes the name(s) of a country's highest level court(s), the number and titles of the judges, and the types of cases heard by the court, which commonly are based on civil, criminal, administrative, and constitutional law. A number of countries have separate constitutional courts. The judge selection and term of office subfield includes the organizations and associated officials responsible for nominating and appointing j . . . more Judicial branch field listing
highest courts: Supreme Court (consists of the chief justice, deputy chief justice, 35 justices, and 5 acting justices); National Courts (consists of 13 courts located in the provincial capitals, with a total of 19 resident judges)
judge selection and term of office: Supreme Court chief justice appointed by the governor general upon advice of the National Executive Council (cabinet) after consultation with the National Justice Administration minister; deputy chief justice and other justices appointed by the Judicial and Legal Services Commission, a 5-member body that includes the Supreme Court chief and deputy chief justices, the chief ombudsman, and a member of the National Parliament; full-time citizen judges appointed for 10-year renewable terms; non-citizen judges initially appointed for 3-year renewable terms and after first renewal can serve until age 70; appointment and tenure of National Court resident judges NA
subordinate courts: district, village, and juvenile courts, military courts, taxation courts, coronial courts, mining warden courts, land courts, traffic courts, committal courts, grade five courts
Political parties and leaders: This entry includes a listing of significant political parties, coalitions, and electoral lists as of each country's last legislative election, unless otherwise noted. Political parties and leaders field listing
National Alliance Party or NAP [Patrick PRUAITCH]
Papua and Niugini Union Party or PANGU [Sam BASIL]
Papua New Guinea Party or PNGP [Belden NAMAH]
People's National Congress Party or PNC [Peter Paire O'NEILL]
People's Party or PP [Peter IPATAS]
People's Progress Party or PPP [Sir Julius CHAN]
Social Democratic Party or SDP [Powes PARKOP]
Triumph Heritage Empowerment Party or THE [Don POLYE]
United Resources Party or URP [William DUMA]
note: as of 8 July 2017, 45 political parties were registered
International organization participation: This entry lists in alphabetical order by abbreviation those international organizations in which the subject country is a member or participates in some other way. International organization participation field listing
ACP, ADB, AOSIS, APEC, ARF, ASEAN (observer), C, CD, CP, EITI (candidate country), FAO, G-77, IAEA, IBRD, ICAO, ICRM, IDA, IFAD, IFC, IFRCS, IHO, ILO, IMF, IMO, Interpol, IOC, IOM, IPU, ISO (correspondent), ITSO, ITU, MIGA, NAM, OPCW, PIF, Sparteca, SPC, UN, UNCTAD, UNESCO, UNIDO, UNMISS, UNWTO, UPU, WCO, WFTU (NGOs), WHO, WIPO, WMO, WTO
Diplomatic representation in the US: This entry includes the chief of mission, chancery address, telephone, FAX, consulate general locations, and consulate locations. The use of the annotated title Appointed Ambassador refers to a new ambassador who has presented his/her credentials to the secretary of state but not the US president. Such ambassadors fulfill all diplomatic functions except meeting with or appearing at functions attended by the president until such time as they formally present their credentials at a White Hou . . . more Diplomatic representation in the US field listing
Ambassador (vacant); Charge D’Affaires Elias Rahuromo WOHENGU (since 30 September 2017)
chancery: 1779 Massachusetts Avenue NW, Suite 805, Washington, DC 20036
telephone: [1] (202) 745-3680
FAX: [1] (202) 745-3679
Diplomatic representation from the US: This entry includes the chief of mission, embassy address, mailing address, telephone number, FAX number, branch office locations, consulate general locations, and consulate locations. Diplomatic representation from the US field listing
chief of mission: Ambassador Erin Elizabeth MCKEE (since 27 November 2019); note - also accredited to the Solomon Islands and Vanuatu
telephone: [675] 321-1455
embassy: P.O. Box 1492, Port Moresby
mailing address: 4240 Port Moresby Place, US Department of State, Washington DC 20521-4240
FAX: [675] 321-3423
Flag description: This entry provides a written flag description produced from actual flags or the best information available at the time the entry was written. The flags of independent states are used by their dependencies unless there is an officially recognized local flag. Some disputed and other areas do not have flags. Flag description field listing
divided diagonally from upper hoist-side corner; the upper triangle is red with a soaring yellow bird of paradise centered; the lower triangle is black with five, white, five-pointed stars of the Southern Cross constellation centered; red, black, and yellow are traditional colors of Papua New Guinea; the bird of paradise - endemic to the island of New Guinea - is an emblem of regional tribal culture and represents the emergence of Papua New Guinea as a nation; the Southern Cross, visible in the night sky, symbolizes Papua New Guinea's connection with Australia and several other countries in the South Pacific
National symbol(s): A national symbol is a faunal, floral, or other abstract representation - or some distinctive object - that over time has come to be closely identified with a country or entity. Not all countries have national symbols; a few countries have more than one. National symbol(s) field listing
bird of paradise; national colors: red, black
National anthem: A generally patriotic musical composition - usually in the form of a song or hymn of praise - that evokes and eulogizes the history, traditions, or struggles of a nation or its people. National anthems can be officially recognized as a national song by a country's constitution or by an enacted law, or simply by tradition. Although most anthems contain lyrics, some do not. National anthem field listing
name: O Arise All You Sons
lyrics/music: Thomas SHACKLADY
note: adopted 1975
Economy :: Papua New Guinea
Economy - overview: This entry briefly describes the type of economy, including the degree of market orientation, the level of economic development, the most important natural resources, and the unique areas of specialization. It also characterizes major economic events and policy changes in the most recent 12 months and may include a statement about one or two key future macroeconomic trends. Economy - overview field listing
Papua New Guinea (PNG) is richly endowed with natural resources, but exploitation has been hampered by rugged terrain, land tenure issues, and the high cost of developing infrastructure. The economy has a small formal sector, focused mainly on the export of those natural resources, and an informal sector, employing the majority of the population. Agriculture provides a subsistence livelihood for 85% of the people. The global financial crisis had little impact because of continued foreign demand for PNG's commodities.
Mineral deposits, including copper, gold, and oil, account for nearly two-thirds of export earnings. Natural gas reserves amount to an estimated 155 billion cubic meters. Following construction of a $19 billion liquefied natural gas (LNG) project, PNG LNG, a consortium led by ExxonMobil, began exporting liquefied natural gas to Asian markets in May 2014. The project was delivered on time and only slightly above budget. The success of the project has encouraged other companies to look at similar LNG projects. French supermajor Total is hopes to begin construction on the Papua LNG project by 2020. Due to lower global commodity prices, resource revenues of all types have fallen dramatically. PNG’s government has recently been forced to adjust spending levels downward.
Numerous challenges still face the government of Peter O'NEILL, including providing physical security for foreign investors, regaining investor confidence, restoring integrity to state institutions, promoting economic efficiency by privatizing moribund state institutions, and maintaining good relations with Australia, its former colonial ruler. Other socio-cultural challenges could upend the economy including chronic law and order and land tenure issues. In August, 2017, PNG launched its first-ever national trade policy, PNG Trade Policy 2017-2032. The policy goal is to maximize trade and investment by increasing exports, to reduce imports, and to increase foreign direct investment (FDI).
GDP (purchasing power parity): This entry gives the gross domestic product (GDP) or value of all final goods and services produced within a nation in a given year. A nation's GDP at purchasing power parity (PPP) exchange rates is the sum value of all goods and services produced in the country valued at prices prevailing in the United States in the year noted. This is the measure most economists prefer when looking at per-capita welfare and when comparing living conditions or use of resources across countries. The measur . . . more GDP (purchasing power parity) field listing
$30.19 billion (2017 est.)
$29.44 billion (2016 est.)
$28.98 billion (2015 est.)
note: data are in 2017 dollars
country comparison to the world: 132
GDP (official exchange rate): This entry gives the gross domestic product (GDP) or value of all final goods and services produced within a nation in a given year. A nation's GDP at official exchange rates (OER) is the home-currency-denominated annual GDP figure divided by the bilateral average US exchange rate with that country in that year. The measure is simple to compute and gives a precise measure of the value of output. Many economists prefer this measure when gauging the economic power an economy maintains vis- . . . more GDP (official exchange rate) field listing
$19.82 billion (2017 est.)
GDP - real growth rate: This entry gives GDP growth on an annual basis adjusted for inflation and expressed as a percent. The growth rates are year-over-year, and not compounded. GDP - real growth rate field listing
2.5% (2017 est.)
1.6% (2016 est.)
5.3% (2015 est.)
country comparison to the world: 131
GDP - per capita (PPP): This entry shows GDP on a purchasing power parity basis divided by population as of 1 July for the same year. GDP - per capita (PPP) field listing
$3,700 (2017 est.)
$3,600 (2016 est.)
$3,700 (2015 est.)
note: data are in 2017 dollars
country comparison to the world: 184
Gross national saving: Gross national saving is derived by deducting final consumption expenditure (household plus government) from Gross national disposable income, and consists of personal saving, plus business saving (the sum of the capital consumption allowance and retained business profits), plus government saving (the excess of tax revenues over expenditures), but excludes foreign saving (the excess of imports of goods and services over exports). The figures are presented as a percent of GDP. A negative . . . more Gross national saving field listing
36.8% of GDP (2017 est.)
38% of GDP (2016 est.)
33.7% of GDP (2015 est.)
country comparison to the world: 14
GDP - composition, by end use: This entry shows who does the spending in an economy: consumers, businesses, government, and foreigners. The distribution gives the percentage contribution to total GDP of household consumption, government consumption, investment in fixed capital, investment in inventories, exports of goods and services, and imports of goods and services, and will total 100 percent of GDP if the data are complete. household consumption consists of expenditures by resident households, and by nonprofit insti . . . more GDP - composition, by end use field listing
household consumption: 43.7% (2017 est.)
government consumption: 19.7% (2017 est.)
investment in fixed capital: 10% (2017 est.)
investment in inventories: 0.4% (2017 est.)
exports of goods and services: 49.3% (2017 est.)
imports of goods and services: -22.3% (2017 est.)
GDP - composition, by sector of origin: This entry shows where production takes place in an economy. The distribution gives the percentage contribution of agriculture, industry, and services to total GDP, and will total 100 percent of GDP if the data are complete. Agriculture includes farming, fishing, and forestry. Industry includes mining, manufacturing, energy production, and construction. Services cover government activities, communications, transportation, finance, and all other private economic activities that do not prod . . . more GDP - composition, by sector of origin field listing
agriculture: 22.1% (2017 est.)
industry: 42.9% (2017 est.)
services: 35% (2017 est.)
Agriculture - products: This entry is an ordered listing of major crops and products starting with the most important. Agriculture - products field listing
coffee, cocoa, copra, palm kernels, tea, sugar, rubber, sweet potatoes, fruit, vegetables, vanilla; poultry, pork; shellfish
Industries: This entry provides a rank ordering of industries starting with the largest by value of annual output. Industries field listing
copra crushing, palm oil processing, plywood production, wood chip production; mining (gold, silver, copper); crude oil and petroleum products; construction, tourism, livestock (pork, poultry, cattle), dairy products, spice products (turmeric, vanilla, ginger, cardamom, chili, pepper, citronella, and nutmeg), fisheries products
Industrial production growth rate: This entry gives the annual percentage increase in industrial production (includes manufacturing, mining, and construction). Industrial production growth rate field listing
3.3% (2017 est.)
country comparison to the world: 97
Labor force: This entry contains the total labor force figure. Labor force field listing
3.681 million (2017 est.)
country comparison to the world: 97
Labor force - by occupation: This entry lists the percentage distribution of the labor force by sector of occupation. Agriculture includes farming, fishing, and forestry. Industry includes mining, manufacturing, energy production, and construction. Services cover government activities, communications, transportation, finance, and all other economic activities that do not produce material goods. The distribution will total less than 100 percent if the data are incomplete and may range from 99-101 percent due to rounding. more Labor force - by occupation field listing
agriculture: 85%
industry: NA
services: NA
Unemployment rate: This entry contains the percent of the labor force that is without jobs. Substantial underemployment might be noted. Unemployment rate field listing
2.5% (2017 est.)
2.5% (2016 est.)
country comparison to the world: 26
Population below poverty line: National estimates of the percentage of the population falling below the poverty line are based on surveys of sub-groups, with the results weighted by the number of people in each group. Definitions of poverty vary considerably among nations. For example, rich nations generally employ more generous standards of poverty than poor nations. Population below poverty line field listing
37% (2002 est.)
Household income or consumption by percentage share: Data on household income or consumption come from household surveys, the results adjusted for household size. Nations use different standards and procedures in collecting and adjusting the data. Surveys based on income will normally show a more unequal distribution than surveys based on consumption. The quality of surveys is improving with time, yet caution is still necessary in making inter-country comparisons. Household income or consumption by percentage share field listing
lowest 10%: 1.7%
highest 10%: 40.5% (1996)
Budget: This entry includes revenues, expenditures, and capital expenditures. These figures are calculated on an exchange rate basis, i.e., not in purchasing power parity (PPP) terms. Budget field listing
revenues: 3.638 billion (2017 est.)
expenditures: 4.591 billion (2017 est.)
Taxes and other revenues: This entry records total taxes and other revenues received by the national government during the time period indicated, expressed as a percent of GDP. Taxes include personal and corporate income taxes, value added taxes, excise taxes, and tariffs. Other revenues include social contributions - such as payments for social security and hospital insurance - grants, and net revenues from public enterprises. Normalizing the data, by dividing total revenues by GDP, enables easy comparisons acr . . . more Taxes and other revenues field listing
18.4% (of GDP) (2017 est.)
country comparison to the world: 160
Budget surplus (+) or deficit (-): This entry records the difference between national government revenues and expenditures, expressed as a percent of GDP. A positive (+) number indicates that revenues exceeded expenditures (a budget surplus), while a negative (-) number indicates the reverse (a budget deficit). Normalizing the data, by dividing the budget balance by GDP, enables easy comparisons across countries and indicates whether a national government saves or borrows money. Countries with high budget deficits (relat . . . more Budget surplus (+) or deficit (-) field listing
-4.8% (of GDP) (2017 est.)
country comparison to the world: 168
Public debt: This entry records the cumulative total of all government borrowings less repayments that are denominated in a country's home currency. Public debt should not be confused with external debt, which reflects the foreign currency liabilities of both the private and public sector and must be financed out of foreign exchange earnings. Public debt field listing
36.9% of GDP (2017 est.)
36.9% of GDP (2016 est.)
country comparison to the world: 144
Fiscal year: This entry identifies the beginning and ending months for a country's accounting period of 12 months, which often is the calendar year but which may begin in any month. All yearly references are for the calendar year (CY) unless indicated as a noncalendar fiscal year (FY). Fiscal year field listing
calendar year
Inflation rate (consumer prices): This entry furnishes the annual percent change in consumer prices compared with the previous year's consumer prices. Inflation rate (consumer prices) field listing
5.4% (2017 est.)
6.7% (2016 est.)
country comparison to the world: 177
Current account balance: This entry records a country's net trade in goods and services, plus net earnings from rents, interest, profits, and dividends, and net transfer payments (such as pension funds and worker remittances) to and from the rest of the world during the period specified. These figures are calculated on an exchange rate basis, i.e., not in purchasing power parity (PPP) terms. Current account balance field listing
$4.859 billion (2017 est.)
$4.569 billion (2016 est.)
country comparison to the world: 29
Exports: This entry provides the total US dollar amount of merchandise exports on an f.o.b. (free on board) basis. These figures are calculated on an exchange rate basis, i.e., not in purchasing power parity (PPP) terms. Exports field listing
$8.522 billion (2017 est.)
$9.224 billion (2016 est.)
country comparison to the world: 95
Exports - partners: This entry provides a rank ordering of trading partners starting with the most important; it sometimes includes the percent of total dollar value. Exports - partners field listing
Australia 18.9%, Singapore 17.5%, Japan 13.8%, China 12.7%, Philippines 4.7%, Netherlands 4.2%, India 4.2% (2017)
Exports - commodities: This entry provides a listing of the highest-valued exported products; it sometimes includes the percent of total dollar value. Exports - commodities field listing
liquefied natural gas, oil, gold, copper ore, nickel, cobalt logs, palm oil, coffee, cocoa, copra, spice (turmeric, vanilla, ginger, and cardamom), crayfish, prawns, tuna, sea cucumber
Imports: This entry provides the total US dollar amount of merchandise imports on a c.i.f. (cost, insurance, and freight) or f.o.b. (free on board) basis. These figures are calculated on an exchange rate basis, i.e., not in purchasing power parity (PPP) terms. Imports field listing
$1.876 billion (2017 est.)
$2.077 billion (2016 est.)
country comparison to the world: 170
Imports - commodities: This entry provides a listing of the highest-valued imported products; it sometimes includes the percent of total dollar value. Imports - commodities field listing
machinery and transport equipment, manufactured goods, food, fuels, chemicals
Imports - partners: This entry provides a rank ordering of trading partners starting with the most important; it sometimes includes the percent of total dollar value. Imports - partners field listing
Australia 30.1%, China 17.3%, Singapore 10.2%, Malaysia 8.2%, Indonesia 4% (2017)
Reserves of foreign exchange and gold: This entry gives the dollar value for the stock of all financial assets that are available to the central monetary authority for use in meeting a country's balance of payments needs as of the end-date of the period specified. This category includes not only foreign currency and gold, but also a country's holdings of Special Drawing Rights in the International Monetary Fund, and its reserve position in the Fund. Reserves of foreign exchange and gold field listing
$1.735 billion (31 December 2017 est.)
$1.656 billion (31 December 2016 est.)
country comparison to the world: 123
Debt - external: This entry gives the total public and private debt owed to nonresidents repayable in internationally accepted currencies, goods, or services. These figures are calculated on an exchange rate basis, i.e., not in purchasing power parity (PPP) terms. Debt - external field listing
$17.94 billion (31 December 2017 est.)
$18.28 billion (31 December 2016 est.)
country comparison to the world: 95
Exchange rates: This entry provides the average annual price of a country's monetary unit for the time period specified, expressed in units of local currency per US dollar, as determined by international market forces or by official fiat. The International Organization for Standardization (ISO) 4217 alphabetic currency code for the national medium of exchange is presented in parenthesis. Closing daily exchange rates are not presented in The World Factbook, but are used to convert stock values - e.g., the . . . more Exchange rates field listing
kina (PGK) per US dollar -
3.179 (2017 est.)
3.133 (2016 est.)
3.133 (2015 est.)
2.7684 (2014 est.)
2.4614 (2013 est.)
Energy :: Papua New Guinea
Electricity access: This entry provides information on access to electricity. Electrification data – collected from industry reports, national surveys, and international sources – consists of four subfields. Population without electricity provides an estimate of the number of citizens that do not have access to electricity. Electrification – total population is the percent of a country’s total population with access to electricity, electrification – urban areas is the percent of a country’s urban population w . . . more Electricity access field listing
electrification - total population: 22.9% (2016)
electrification - urban areas: 72.7% (2016)
electrification - rural areas: 15.5% (2016)
Electricity - production: This entry is the annual electricity generated expressed in kilowatt-hours. The discrepancy between the amount of electricity generated and/or imported and the amount consumed and/or exported is accounted for as loss in transmission and distribution. Electricity - production field listing
3.481 billion kWh (2016 est.)
country comparison to the world: 129
Electricity - consumption: This entry consists of total electricity generated annually plus imports and minus exports, expressed in kilowatt-hours. The discrepancy between the amount of electricity generated and/or imported and the amount consumed and/or exported is accounted for as loss in transmission and distribution. Electricity - consumption field listing
3.237 billion kWh (2016 est.)
country comparison to the world: 134
Electricity - exports: This entry is the total exported electricity in kilowatt-hours. Electricity - exports field listing
0 kWh (2017 est.)
country comparison to the world: 183
Electricity - imports: This entry is the total imported electricity in kilowatt-hours. Electricity - imports field listing
0 kWh (2016 est.)
country comparison to the world: 184
Electricity - installed generating capacity: This entry is the total capacity of currently installed generators, expressed in kilowatts (kW), to produce electricity. A 10-kilowatt (kW) generator will produce 10 kilowatt hours (kWh) of electricity, if it runs continuously for one hour. Electricity - installed generating capacity field listing
900,900 kW (2016 est.)
country comparison to the world: 131
Electricity - from fossil fuels: This entry measures the capacity of plants that generate electricity by burning fossil fuels (such as coal, petroleum products, and natural gas), expressed as a share of the country's total generating capacity. Electricity - from fossil fuels field listing
63% of total installed capacity (2016 est.)
country comparison to the world: 123
Electricity - from nuclear fuels: This entry measures the capacity of plants that generate electricity through radioactive decay of nuclear fuel, expressed as a share of the country's total generating capacity. Electricity - from nuclear fuels field listing
0% of total installed capacity (2017 est.)
country comparison to the world: 162
Electricity - from hydroelectric plants: This entry measures the capacity of plants that generate electricity by water-driven turbines, expressed as a share of the country's total generating capacity. Electricity - from hydroelectric plants field listing
30% of total installed capacity (2017 est.)
country comparison to the world: 69
Electricity - from other renewable sources: This entry measures the capacity of plants that generate electricity by using renewable energy sources other than hydroelectric (including, for example, wind, waves, solar, and geothermal), expressed as a share of the country's total generating capacity. Electricity - from other renewable sources field listing
7% of total installed capacity (2017 est.)
country comparison to the world: 95
Crude oil - production: This entry is the total amount of crude oil produced, in barrels per day (bbl/day). Crude oil - production field listing
45,000 bbl/day (2018 est.)
country comparison to the world: 55
Crude oil - exports: This entry is the total amount of crude oil exported, in barrels per day (bbl/day). Crude oil - exports field listing
55,600 bbl/day (2015 est.)
country comparison to the world: 41
Crude oil - imports: This entry is the total amount of crude oil imported, in barrels per day (bbl/day). Crude oil - imports field listing
22,220 bbl/day (2015 est.)
country comparison to the world: 62
Crude oil - proved reserves: This entry is the stock of proved reserves of crude oil, in barrels (bbl). Proved reserves are those quantities of petroleum which, by analysis of geological and engineering data, can be estimated with a high degree of confidence to be commercially recoverable from a given date forward, from known reservoirs and under current economic conditions. Crude oil - proved reserves field listing
183.8 million bbl (1 January 2018 est.)
country comparison to the world: 57
Refined petroleum products - production: This entry is the country's total output of refined petroleum products, in barrels per day (bbl/day). The discrepancy between the amount of refined petroleum products produced and/or imported and the amount consumed and/or exported is due to the omission of stock changes, refinery gains, and other complicating factors. Refined petroleum products - production field listing
22,170 bbl/day (2015 est.)
country comparison to the world: 88
Refined petroleum products - consumption: This entry is the country's total consumption of refined petroleum products, in barrels per day (bbl/day). The discrepancy between the amount of refined petroleum products produced and/or imported and the amount consumed and/or exported is due to the omission of stock changes, refinery gains, and other complicating factors. Refined petroleum products - consumption field listing
37,000 bbl/day (2016 est.)
country comparison to the world: 116
Refined petroleum products - exports: This entry is the country's total exports of refined petroleum products, in barrels per day (bbl/day). Refined petroleum products - exports field listing
0 bbl/day (2015 est.)
country comparison to the world: 190
Refined petroleum products - imports: This entry is the country's total imports of refined petroleum products, in barrels per day (bbl/day). Refined petroleum products - imports field listing
17,110 bbl/day (2015 est.)
country comparison to the world: 134
Natural gas - production: This entry is the total natural gas produced in cubic meters (cu m). The discrepancy between the amount of natural gas produced and/or imported and the amount consumed and/or exported is due to the omission of stock changes and other complicating factors. Natural gas - production field listing
11.18 billion cu m (2017 est.)
country comparison to the world: 39
Natural gas - consumption: This entry is the total natural gas consumed in cubic meters (cu m). The discrepancy between the amount of natural gas produced and/or imported and the amount consumed and/or exported is due to the omission of stock changes and other complicating factors. Natural gas - consumption field listing
99.11 million cu m (2017 est.)
country comparison to the world: 109
Natural gas - exports: This entry is the total natural gas exported in cubic meters (cu m). Natural gas - exports field listing
11.1 billion cu m (2017 est.)
country comparison to the world: 21
Natural gas - imports: This entry is the total natural gas imported in cubic meters (cu m). Natural gas - imports field listing
0 cu m (2017 est.)
country comparison to the world: 172
Natural gas - proved reserves: This entry is the stock of proved reserves of natural gas in cubic meters (cu m). Proved reserves are those quantities of natural gas, which, by analysis of geological and engineering data, can be estimated with a high degree of confidence to be commercially recoverable from a given date forward, from known reservoirs and under current economic conditions. Natural gas - proved reserves field listing
210.5 billion cu m (1 January 2018 est.)
country comparison to the world: 41
Carbon dioxide emissions from consumption of energy: This entry is the total amount of carbon dioxide, measured in metric tons, released by burning fossil fuels in the process of producing and consuming energy. Carbon dioxide emissions from consumption of energy field listing
6.082 million Mt (2017 est.)
country comparison to the world: 129
Communications :: Papua New Guinea
Telephones - fixed lines: This entry gives the total number of fixed telephone lines in use, as well as the number of subscriptions per 100 inhabitants. Telephones - fixed lines field listing
total subscriptions: 154,000
subscriptions per 100 inhabitants: 2 (July 2016 est.)
country comparison to the world: 128
Telephones - mobile cellular: This entry gives the total number of mobile cellular telephone subscribers, as well as the number of subscriptions per 100 inhabitants. Note that because of the ubiquity of mobile phone use in developed countries, the number of subscriptions per 100 inhabitants can exceed 100. Telephones - mobile cellular field listing
total subscriptions: 3.782 million
subscriptions per 100 inhabitants: 55 (July 2016 est.)
country comparison to the world: 131
Telecommunication systems: This entry includes a brief general assessment of the telecommunications system with details on the domestic and international components. The following terms and abbreviations are used throughout the entry: Arabsat - Arab Satellite Communications Organization (Riyadh, Saudi Arabia). Autodin - Automatic Digital Network (US Department of Defense). CB - citizen's band mobile radio communications. Cellular telephone system - the telephones in this system are radio transceivers, with each inst . . . more Telecommunication systems field listing
general assessment: services are minimal; Internet slow and expensive; facilities provide radiotelephone and telegraph, coastal radio, aeronautical radio, and international radio communication services; a great deal of the population is under served in telecommunications; terrain, living conditions and economice stability is not high; 2G still exists in rural areas, 3G and 4G LTE in urban areas; the launch of the Kacific-1 satellite in 2019, will improve most services in the region (2020)
domestic: access to telephone services is not widely available; fixed-line 2 per 100 and mobile-cellular 55 per 100 person, teledensity has increased (2018)
international: country code - 675; landing points for the Kumul Domestic Submarine Cable System, PNG-LNG, APNG-2, CSCS and the PPC-1 submarine cables to Australia, Guam, PNG and Solomon Islands; satellite earth station - 1 Intelsat (Pacific Ocean) (2019)
the COVID-19 outbreak is negatively impacting telecommunications production and supply chains globally; consumer spending on telecom devices and services has also slowed due to the pandemic's effect on economies worldwide; overall progress towards improvements in all facets of the telecom industry - mobile, fixed-line, broadband, submarine cable and satellite - has moderated
Broadcast media: This entry provides information on the approximate number of public and private TV and radio stations in a country, as well as basic information on the availability of satellite and cable TV services. Broadcast media field listing
4 TV stations: 1 commercial station operating since 1987, 1 state-run station launched in 2008, 1 digital free-to-view network launched in 2014, and 1 satellite network Click TV (PNGTV) launched in 2015; the state-run National Broadcasting Corporation operates 3 radio networks with multiple repeaters and about 20 provincial stations; several commercial radio stations with multiple transmission points as well as several community stations; transmissions of several international broadcasters are accessible (2018)
Internet country code: This entry includes the two-letter codes maintained by the International Organization for Standardization (ISO) in the ISO 3166 Alpha-2 list and used by the Internet Assigned Numbers Authority (IANA) to establish country-coded top-level domains (ccTLDs). Internet country code field listing
.pg
Internet users: This entry gives the total number of individuals within a country who can access the Internet at home, via any device type (computer or mobile) and connection. The percent of population with Internet access (i.e., the penetration rate) helps gauge how widespread Internet use is within a country. Statistics vary from country to country and may include users who access the Internet at least several times a week to those who access it only once within a period of several months. Internet users field listing
total: 652,071
percent of population: 9.6% (July 2016 est.)
country comparison to the world: 145
Broadband - fixed subscriptions: This entry gives the total number of fixed-broadband subscriptions, as well as the number of subscriptions per 100 inhabitants. Fixed broadband is a physical wired connection to the Internet (e.g., coaxial cable, optical fiber) at speeds equal to or greater than 256 kilobits/second (256 kbit/s). Broadband - fixed subscriptions field listing
total: 17,000
subscriptions per 100 inhabitants: less than 1 (2017 est.)
country comparison to the world: 157
Military and Security :: Papua New Guinea
Military expenditures: This entry gives spending on defense programs for the most recent year available as a percent of gross domestic product (GDP); the GDP is calculated on an exchange rate basis, i.e., not in terms of purchasing power parity (PPP). For countries with no military forces, this figure can include expenditures on public security and police. Military expenditures field listing
0.27% of GDP (2018)
0.34% of GDP (2017)
0.39% of GDP (2016)
0.47% of GDP (2015)
0.49% of GDP (2014)
country comparison to the world: 156
Military and security forces: This entry lists the military and security forces subordinate to defense ministries or the equivalent (typically ground, naval, air, and marine forces), as well as those belonging to interior ministries or the equivalent (typically gendarmeries, border/coast guards, paramilitary police, and other internal security forces). Military and security forces field listing
Papua New Guinea Defense Force (PNGDF, includes land, maritime, and air elements) (2019)
Military service age and obligation: This entry gives the required ages for voluntary or conscript military service and the length of service obligation. Military service age and obligation field listing
16 years of age for voluntary military service (with parental consent); no conscription; graduation from grade 12 required (2013)
Transportation :: Papua New Guinea
National air transport system: This entry includes four subfields describing the air transport system of a given country in terms of both structure and performance. The first subfield, number of registered air carriers, indicates the total number of air carriers registered with the country’s national aviation authority and issued an air operator certificate as required by the Convention on International Civil Aviation. The second subfield, inventory of registered aircraft operated by air carriers, lists the total number . . . more National air transport system field listing
number of registered air carriers: 6 (2015)
inventory of registered aircraft operated by air carriers: 47 (2015)
annual passenger traffic on registered air carriers: 2,062,584 (2015)
annual freight traffic on registered air carriers: 34,827,034 mt-km (2015)
Civil aircraft registration country code prefix: This entry provides the one- or two-character alphanumeric code indicating the nationality of civil aircraft. Article 20 of the Convention on International Civil Aviation (Chicago Convention), signed in 1944, requires that all aircraft engaged in international air navigation bear appropriate nationality marks. The aircraft registration number consists of two parts: a prefix consisting of a one- or two-character alphanumeric code indicating nationality and a registration suffix of one to fi . . . more Civil aircraft registration country code prefix field listing
P2 (2016)
Airports: This entry gives the total number of airports or airfields recognizable from the air. The runway(s) may be paved (concrete or asphalt surfaces) or unpaved (grass, earth, sand, or gravel surfaces) and may include closed or abandoned installations. Airports or airfields that are no longer recognizable (overgrown, no facilities, etc.) are not included. Note that not all airports have accommodations for refueling, maintenance, or air traffic control. Airports field listing
561 (2013)
country comparison to the world: 11
Airports - with paved runways: This entry gives the total number of airports with paved runways (concrete or asphalt surfaces) by length. For airports with more than one runway, only the longest runway is included according to the following five groups - (1) over 3,047 m (over 10,000 ft), (2) 2,438 to 3,047 m (8,000 to 10,000 ft), (3) 1,524 to 2,437 m (5,000 to 8,000 ft), (4) 914 to 1,523 m (3,000 to 5,000 ft), and (5) under 914 m (under 3,000 ft). Only airports with usable runways are included in this listing. Not all . . . more Airports - with paved runways field listing
total: 21 (2017)
over 3,047 m: 1 (2017)
2,438 to 3,047 m: 2 (2017)
1,524 to 2,437 m: 12 (2017)
914 to 1,523 m: 5 (2017)
under 914 m: 1 (2017)
Airports - with unpaved runways: This entry gives the total number of airports with unpaved runways (grass, dirt, sand, or gravel surfaces) by length. For airports with more than one runway, only the longest runway is included according to the following five groups - (1) over 3,047 m (over 10,000 ft), (2) 2,438 to 3,047 m (8,000 to 10,000 ft), (3) 1,524 to 2,437 m (5,000 to 8,000 ft), (4) 914 to 1,523 m (3,000 to 5,000 ft), and (5) under 914 m (under 3,000 ft). Only airports with usable runways are included in this listin . . . more Airports - with unpaved runways field listing
total: 540 (2013)
1,524 to 2,437 m: 11 (2013)
914 to 1,523 m: 53 (2013)
under 914 m: 476 (2013)
Heliports: This entry gives the total number of heliports with hard-surface runways, helipads, or landing areas that support routine sustained helicopter operations exclusively and have support facilities including one or more of the following facilities: lighting, fuel, passenger handling, or maintenance. It includes former airports used exclusively for helicopter operations but excludes heliports limited to day operations and natural clearings that could support helicopter landings and takeoffs. Heliports field listing
2 (2013)
Pipelines: This entry gives the lengths and types of pipelines for transporting products like natural gas, crude oil, or petroleum products. Pipelines field listing
264 km oil (2013)
Roadways: This entry gives the total length of the road network and includes the length of the paved and unpaved portions. Roadways field listing
total: 9,349 km (2011)
paved: 3,000 km (2011)
unpaved: 6,349 km (2011)
country comparison to the world: 132
Waterways: This entry gives the total length of navigable rivers, canals, and other inland bodies of water. Waterways field listing
11,000 km (2011)
country comparison to the world: 12
Merchant marine: This entry provides the total and the number of each type of privately or publicly owned commercial ship for each country; military ships are not included; the five ships by type include: bulk carrier - for cargo such as coal, grain, cement, ores, and gravel; container ship - for loads in truck-size containers, a transportation system called containerization; general cargo - also referred to as break-bulk containers - for a wide variety of packaged merchandise, such as textiles, furniture . . . more Merchant marine field listing
total: 171
by type: bulk carrier 7, general cargo 76, oil tanker 3, other 85 (2019)
country comparison to the world: 69
Ports and terminals: This entry lists major ports and terminals primarily on the basis of the amount of cargo tonnage shipped through the facilities on an annual basis. In some instances, the number of containers handled or ship visits were also considered. Most ports service multiple classes of vessels including bulk carriers (dry and liquid), break bulk cargoes (goods loaded individually in bags, boxes, crates, or drums; sometimes palletized), containers, roll-on/roll-off, and passenger ships. The listing le . . . more Ports and terminals field listing
major seaport(s): Kimbe, Lae, Madang, Rabaul, Wewak
LNG terminal(s) (export): Port Moresby
Transnational Issues :: Papua New Guinea
Disputes - international: This entry includes a wide variety of situations that range from traditional bilateral boundary disputes to unilateral claims of one sort or another. Information regarding disputes over international terrestrial and maritime boundaries has been reviewed by the US Department of State. References to other situations involving borders or frontiers may also be included, such as resource disputes, geopolitical questions, or irredentist issues; however, inclusion does not necessarily constitute . . . more Disputes - international field listing
relies on assistance from Australia to keep out illegal cross-border activities from primarily Indonesia, including goods smuggling, illegal narcotics trafficking, and squatters and secessionists
Refugees and internally displaced persons: This entry includes those persons residing in a country as refugees, internally displaced persons (IDPs), or stateless persons. Each country's refugee entry includes only countries of origin that are the source of refugee populations of 5,000 or more. The definition of a refugee according to a UN Convention is "a person who is outside his/her country of nationality or habitual residence; has a well-founded fear of persecution because of his/her race, religion, nationality, membership in a . . . more Refugees and internally displaced persons field listing
refugees (country of origin): 9,368 (Indonesia) (2018)
IDPs: 12,000 (natural disasters, tribal conflict, inter-communal violence, development projects) (2017)
Trafficking in persons: Trafficking in persons is modern-day slavery, involving victims who are forced, defrauded, or coerced into labor or sexual exploitation. The International Labor Organization (ILO), the UN agency charged with addressing labor standards, employment, and social protection issues, estimated in 2011 that 20.9 million people worldwide were victims of forced labor, bonded labor, forced child labor, sexual servitude, and involuntary servitude. Human trafficking is a multi-dimensional threat, depri . . . more Trafficking in persons field listing
current situation: Papua New Guinea is a source and destination country for men, women, and children subjected to sex trafficking and forced labor; foreign and Papua New Guinean women and children are subjected to sex trafficking, domestic servitude, forced begging, and street vending; parents may sell girls into forced marriages to settle debts or as peace offerings or trade them to another tribe to forge a political alliance, leaving them vulnerable to forced domestic service, or, in urban areas, they may prostitute their children for income or to pay school fees; Chinese, Malaysian, and local men are forced to labor in logging and mining camps through debt bondage schemes; migrant women from Indonesia, Malaysia, Thailand, China, and the Philippines are subjected to sex trafficking and domestic servitude at logging and mining camps, fisheries, and entertainment sites
tier rating: Tier 2 Watch List - Papua New Guinea does not fully comply with the minimum standards for the elimination of trafficking; however, it is making significant efforts to do so; the Criminal Code Amendment of 2013, which prohibits all forms of trafficking was brought into force in 2014; the government also formed an anti-trafficking committee, which drafted a national action plan; despite corruption problems, trafficking-related crimes were prosecuted in village courts rather than criminal courts, resulting in restitution to the victim but no prison time for offenders; the government did not investigate, prosecute, or convict any officials or law enforcement personnel complicit in trafficking offenses; the government made no efforts to proactively identify trafficking victims, has no formal victim identification and referral mechanism, and does not provide care facilities to victims or funding to shelters run by NGOs or international organizations (2015)
Illicit drugs: This entry gives information on the five categories of illicit drugs - narcotics, stimulants, depressants (sedatives), hallucinogens, and cannabis. These categories include many drugs legally produced and prescribed by doctors as well as those illegally produced and sold outside of medical channels. Cannabis (Cannabis sativa) is the common hemp plant, which provides hallucinogens with some sedative properties, and includes marijuana (pot, Acapulco gold, grass, reefer), tetrahydroca . . . more Illicit drugs field listing
major consumer of cannabis
