
.
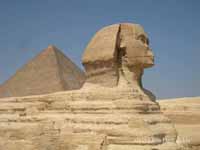
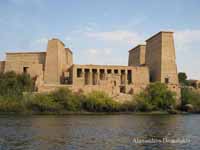
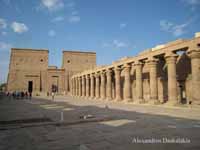
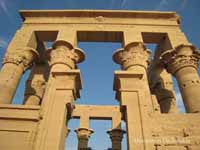
Egypt
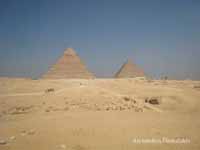
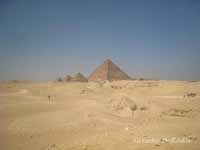
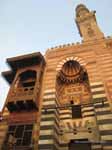
Egypt, Photgraphy 19th century
EN :
The Treasury of Ancient Egypt, Arthur E. P. B. Weigall
Ancient Egypt, George Rawlinson
History Of Egypt From 330 B.C. To The Present Time, Volume 10 , Volume 11, Volume 12, (of 12), S. Rappoport
A history of art in ancient Egypt, Vol. I , Vol. II , Chipiez and Perrot
The Religion of Ancient Egypt, W. M. Flinders Petrie
Egyptian Ideas of the Future Life, E. A. Wallis Budge
The Literature of the Ancient Egyptians, E. A. Wallis Budge
Ancient Egyptian and Greek Looms , Henry Ling Roth
NL :
Het moderne Egypte: Wat er te zien en te hooren valt tusschen Kaïro en Faschoda, A. B. de Guerville
Een feudale familie in Egypte, E. Amelineau
Mythen en Legenden van Egypte, Lewis Spence and J. W. van Rooijen
Egypt (Africa)
Introduction :: Egypt
Background: This entry usually highlights major historic events and current issues and may include a statement about one or two key future trends. Background field listing
The regularity and richness of the annual Nile River flood, coupled with semi-isolation provided by deserts to the east and west, allowed for the development of one of the world's great civilizations. A unified kingdom arose circa 3200 B.C., and a series of dynasties ruled in Egypt for the next three millennia. The last native dynasty fell to the Persians in 341 B.C., who in turn were replaced by the Greeks, Romans, and Byzantines. It was the Arabs who introduced Islam and the Arabic language in the 7th century and who ruled for the next six centuries. A local military caste, the Mamluks took control about 1250 and continued to govern after the conquest of Egypt by the Ottoman Turks in 1517. Completion of the Suez Canal in 1869 elevated Egypt as an important world transportation hub. Ostensibly to protect its investments, Britain seized control of Egypt's government in 1882, but nominal allegiance to the Ottoman Empire continued until 1914. Partially independent from the UK in 1922, Egypt acquired full sovereignty from Britain in 1952. The completion of the Aswan High Dam in 1971 and the resultant Lake Nasser have reaffirmed the time-honored place of the Nile River in the agriculture and ecology of Egypt. A rapidly growing population (the largest in the Arab world), limited arable land, and dependence on the Nile all continue to overtax resources and stress society. The government has struggled to meet the demands of Egypt's fast-growing population as it implements far-reaching economic reforms, including the reduction of select subsidies, large-scale infrastructure projects, energy cooperation, and foreign direct investment appeals.
Inspired by the 2010 Tunisian revolution, Egyptian opposition groups led demonstrations and labor strikes countrywide, culminating in President Hosni MUBARAK's ouster in 2011. Egypt's military assumed national leadership until a new legislature was in place in early 2012; later that same year, Muhammad MURSI won the presidential election. Following protests throughout the spring of 2013 against MURSI's government and the Muslim Brotherhood, the Egyptian Armed Forces intervened and removed MURSI from power in July 2013 and replaced him with interim president Adly MANSOUR. Simultaneously, the government began enacting laws to limit freedoms of assembly and expression. In January 2014, voters approved a new constitution by referendum and in May 2014 elected former defense minister Abdelfattah ELSISI president. Egypt elected a new legislature in December 2015, its first Hose of Representatives since 2012. ELSISI was reelected to a second four-year term in March 2018. In April 2019, Egypt approved via national referendum a set of constitutional amendments extending ELSISI’s term in office through 2024 and possibly through 2030 if re-elected for a third term. The amendments would also allow future presidents up to two consecutive six-year terms in office, re-establish an upper legislative house, allow for one or more vice presidents, establish a 25% quota for female legislators, reaffirm the military’s role as guardian of Egypt, and expand presidential authority to appoint the heads of judicial councils.
Geography ::Egypt
Location: This entry identifies the country's regional location, neighboring countries, and adjacent bodies of water. Location field listing
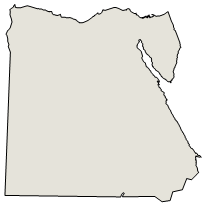
Northern Africa, bordering the Mediterranean Sea, between Libya and the Gaza Strip, and the Red Sea north of Sudan, and includes the Asian Sinai Peninsula
Geographic coordinates: This entry includes rounded latitude and longitude figures for the centroid or center point of a country expressed in degrees and minutes; it is based on the locations provided in the Geographic Names Server (GNS), maintained by the National Geospatial-Intelligence Agency on behalf of the US Board on Geographic Names. Geographic coordinates field listing
27 00 N, 30 00 E
Map references: This entry includes the name of the Factbook reference map on which a country may be found. Note that boundary representations on these maps are not necessarily authoritative. The entry on Geographic coordinates may be helpful in finding some smaller countries. Map references field listing
Africa
Area: This entry includes three subfields. Total area is the sum of all land and water areas delimited by international boundaries and/or coastlines. Land area is the aggregate of all surfaces delimited by international boundaries and/or coastlines, excluding inland water bodies (lakes, reservoirs, rivers). Water area is the sum of the surfaces of all inland water bodies, such as lakes, reservoirs, or rivers, as delimited by international boundaries and/or coastlines. Area field listing
total: 1,001,450 sq km
land: 995,450 sq km
water: 6,000 sq km
country comparison to the world: 31
Area - comparative: This entry provides an area comparison based on total area equivalents. Most entities are compared with the entire US or one of the 50 states based on area measurements (1990 revised) provided by the US Bureau of the Census. The smaller entities are compared with Washington, DC (178 sq km, 69 sq mi) or The Mall in Washington, DC (0.59 sq km, 0.23 sq mi, 146 acres). Area - comparative field listing
more than eight times the size of Ohio; slightly more than three times the size of New Mexico
Area comparison map: Area comparison map
Land boundaries: This entry contains the total length of all land boundaries and the individual lengths for each of the contiguous border countries. When available, official lengths published by national statistical agencies are used. Because surveying methods may differ, country border lengths reported by contiguous countries may differ. Land boundaries field listing
total: 2,612 km
border countries (4): Gaza Strip 13 km, Israel 208 km, Libya 1115 km, Sudan 1276 km
Coastline: This entry gives the total length of the boundary between the land area (including islands) and the sea. Coastline field listing
2,450 km
Maritime claims: This entry includes the following claims, the definitions of which are excerpted from the United Nations Convention on the Law of the Sea (UNCLOS), which alone contains the full and definitive descriptions: territorial sea - the sovereignty of a coastal state extends beyond its land territory and internal waters to an adjacent belt of sea, described as the territorial sea in the UNCLOS (Part II); this sovereignty extends to the air space over the territorial sea as well as its underlying s . . . more Maritime claims field listing
territorial sea: 12 nm
exclusive economic zone: 200 nm or the equidistant median line with Cyprus
contiguous zone: 24 nm
continental shelf: 200 nm
Climate: This entry includes a brief description of typical weather regimes throughout the year; in the Word entry only, it includes four subfields that describe climate extremes:ten driest places on earth (average annual precipitation) describes the annual average precipitation measured in both millimeters and inches for selected countries with climate extremes. ten wettest places on earth (average annual precipitation) describes the annual average precipitation measured in both millimeters and i . . . more Climate field listing
desert; hot, dry summers with moderate winters
Terrain: This entry contains a brief description of the topography. Terrain field listing
vast desert plateau interrupted by Nile valley and delta
Elevation: This entry includes the mean elevation and elevation extremes, lowest point and highest point. Elevation field listing
mean elevation: 321 m
lowest point: Qattara Depression -133 m
highest point: Mount Catherine 2,629 m
Natural resources: This entry lists a country's mineral, petroleum, hydropower, and other resources of commercial importance, such as rare earth elements (REEs). In general, products appear only if they make a significant contribution to the economy, or are likely to do so in the future. Natural resources field listing
petroleum, natural gas, iron ore, phosphates, manganese, limestone, gypsum, talc, asbestos, lead, rare earth elements, zinc
Land use: This entry contains the percentage shares of total land area for three different types of land use: agricultural land, forest, and other; agricultural land is further divided into arable land - land cultivated for crops like wheat, maize, and rice that are replanted after each harvest, permanent crops - land cultivated for crops like citrus, coffee, and rubber that are not replanted after each harvest, and includes land under flowering shrubs, fruit trees, nut trees, and vines, and permane . . . more Land use field listing
agricultural land: 3.6% (2011 est.)
arable land: 2.8% (2011 est.) / permanent crops: 0.8% (2011 est.) / permanent pasture: 0% (2011 est.)
forest: 0.1% (2011 est.)
other: 96.3% (2011 est.)
Irrigated land: This entry gives the number of square kilometers of land area that is artificially supplied with water. Irrigated land field listing
36,500 sq km (2012)
Population distribution: This entry provides a summary description of the population dispersion within a country. While it may suggest population density, it does not provide density figures. Population distribution field listing
approximately 95% of the population lives within 20 km of the Nile River and its delta; vast areas of the country remain sparsely populated or uninhabited
Natural hazards: This entry lists potential natural disasters. For countries where volcanic activity is common, a volcanism subfield highlights historically active volcanoes. Natural hazards field listing
periodic droughts; frequent earthquakes; flash floods; landslides; hot, driving windstorms called khamsin occur in spring; dust storms; sandstorms
Environment - current issues: This entry lists the most pressing and important environmental problems. The following terms and abbreviations are used throughout the entry: Acidification - the lowering of soil and water pH due to acid precipitation and deposition usually through precipitation; this process disrupts ecosystem nutrient flows and may kill freshwater fish and plants dependent on more neutral or alkaline conditions (see acid rain). Acid rain - characterized as containing harmful levels of sulfur dioxi . . . more Environment - current issues field listing
agricultural land being lost to urbanization and windblown sands; increasing soil salination below Aswan High Dam; desertification; oil pollution threatening coral reefs, beaches, and marine habitats; other water pollution from agricultural pesticides, raw sewage, and industrial effluents; limited natural freshwater resources away from the Nile, which is the only perennial water source; rapid growth in population overstraining the Nile and natural resources
Environment - international agreements: This entry separates country participation in international environmental agreements into two levels - party to and signed, but not ratified. Agreements are listed in alphabetical order by the abbreviated form of the full name. Environment - international agreements field listing
party to: Biodiversity, Climate Change, Climate Change-Kyoto Protocol, Desertification, Endangered Species, Environmental Modification, Hazardous Wastes, Law of the Sea, Marine Dumping, Ozone Layer Protection, Ship Pollution, Tropical Timber 83, Tropical Timber 94, Wetlands
signed, but not ratified: none of the selected agreements
Geography - note: This entry includes miscellaneous geographic information of significance not included elsewhere. Geography - note field listing
controls Sinai Peninsula, the only land bridge between Africa and remainder of Eastern Hemisphere; controls Suez Canal, a sea link between Indian Ocean and Mediterranean Sea; size, and juxtaposition to Israel, establish its major role in Middle Eastern geopolitics; dependence on upstream neighbors; dominance of Nile basin issues; prone to influxes of refugees from Sudan and the Palestinian territories
People and Society :: Egypt
Population: This entry gives an estimate from the US Bureau of the Census based on statistics from population censuses, vital statistics registration systems, or sample surveys pertaining to the recent past and on assumptions about future trends. The total population presents one overall measure of the potential impact of the country on the world and within its region. Note: Starting with the 1993 Factbook, demographic estimates for some countries (mostly African) have explicitly taken into account t . . . more Population field listing
104,124,440 (July 2020 est.)
country comparison to the world: 14
Nationality: This entry provides the identifying terms for citizens - noun and adjective. Nationality field listing
noun: Egyptian(s)
adjective: Egyptian
Ethnic groups: This entry provides an ordered listing of ethnic groups starting with the largest and normally includes the percent of total population. Ethnic groups field listing
Egyptian 99.7%, other 0.3% (2006 est.)
note: data represent respondents by nationality
Languages: This entry provides a listing of languages spoken in each country and specifies any that are official national or regional languages. When data is available, the languages spoken in each country are broken down according to the percent of the total population speaking each language as a first language. For those countries without available data, languages are listed in rank order based on prevalence, starting with the most-spoken language. Languages field listing
Arabic (official), Arabic, English, and French widely understood by educated classes
Religions: This entry is an ordered listing of religions by adherents starting with the largest group and sometimes includes the percent of total population. The core characteristics and beliefs of the world's major religions are described below. Baha'i - Founded by Mirza Husayn-Ali (known as Baha'u'llah) in Iran in 1852, Baha'i faith emphasizes monotheism and believes in one eternal transcendent God. Its guiding focus is to encourage the unity of all peoples on the earth so that justice and peace m . . . more Religions field listing
Muslim (predominantly Sunni) 90%, Christian (majority Coptic Orthodox, other Christians include Armenian Apostolic, Catholic, Maronite, Orthodox, and Anglican) 10% (2015 est.)
MENA religious affiliation: Adobe
PDF
Demographic profile: This entry describes a country’s key demographic features and trends and how they vary among regional, ethnic, and socioeconomic sub-populations. Some of the topics addressed are population age structure, fertility, health, mortality, poverty, education, and migration. Demographic profile field listing
Egypt is the most populous country in the Arab world and the third most populous country in Africa, behind Nigeria and Ethiopia. Most of the country is desert, so about 95% of the population is concentrated in a narrow strip of fertile land along the Nile River, which represents only about 5% of Egypt’s land area. Egypt’s rapid population growth – 46% between 1994 and 2014 – stresses limited natural resources, jobs, housing, sanitation, education, and health care.
Although the country’s total fertility rate (TFR) fell from roughly 5.5 children per woman in 1980 to just over 3 in the late 1990s, largely as a result of state-sponsored family planning programs, the population growth rate dropped more modestly because of decreased mortality rates and longer life expectancies. During the last decade, Egypt’s TFR decline stalled for several years and then reversed, reaching 3.6 in 2011, and has plateaued the last few years. Contraceptive use has held steady at about 60%, while preferences for larger families and early marriage may have strengthened in the wake of the recent 2011 revolution. The large cohort of women of or nearing childbearing age will sustain high population growth for the foreseeable future (an effect called population momentum).
Nevertheless, post-MUBARAK governments have not made curbing population growth a priority. To increase contraceptive use and to prevent further overpopulation will require greater government commitment and substantial social change, including encouraging smaller families and better educating and empowering women. Currently, literacy, educational attainment, and labor force participation rates are much lower for women than men. In addition, the prevalence of violence against women, the lack of female political representation, and the perpetuation of the nearly universal practice of female genital cutting continue to keep women from playing a more significant role in Egypt’s public sphere.
Population pressure, poverty, high unemployment, and the fragmentation of inherited land holdings have historically motivated Egyptians, primarily young men, to migrate internally from rural and smaller urban areas in the Nile Delta region and the poorer rural south to Cairo, Alexandria, and other urban centers in the north, while a much smaller number migrated to the Red Sea and Sinai areas. Waves of forced internal migration also resulted from the 1967 Arab-Israeli War and the floods caused by the completion of the Aswan High Dam in 1970. Limited numbers of students and professionals emigrated temporarily prior to the early 1970s, when economic problems and high unemployment pushed the Egyptian Government to lift restrictions on labor migration. At the same time, high oil revenues enabled Saudi Arabia, Iraq, and other Gulf states, as well as Libya and Jordan, to fund development projects, creating a demand for unskilled labor (mainly in construction), which attracted tens of thousands of young Egyptian men.
Between 1970 and 1974 alone, Egyptian migrants in the Gulf countries increased from approximately 70,000 to 370,000. Egyptian officials encouraged legal labor migration both to alleviate unemployment and to generate remittance income (remittances continue to be one of Egypt’s largest sources of foreign currency and GDP). During the mid-1980s, however, depressed oil prices resulting from the Iran-Iraq War, decreased demand for low-skilled labor, competition from less costly South Asian workers, and efforts to replace foreign workers with locals significantly reduced Egyptian migration to the Gulf States. The number of Egyptian migrants dropped from a peak of almost 3.3 million in 1983 to about 2.2 million at the start of the 1990s, but numbers gradually recovered.
In the 2000s, Egypt began facilitating more labor migration through bilateral agreements, notably with Arab countries and Italy, but illegal migration to Europe through overstayed visas or maritime human smuggling via Libya also rose. The Egyptian Government estimated there were 6.5 million Egyptian migrants in 2009, with roughly 75% being temporary migrants in other Arab countries (Libya, Saudi Arabia, Jordan, Kuwait, and the United Arab Emirates) and 25% being predominantly permanent migrants in the West (US, UK, Italy, France, and Canada).
During the 2000s, Egypt became an increasingly important transit and destination country for economic migrants and asylum seekers, including Palestinians, East Africans, and South Asians and, more recently, Iraqis and Syrians. Egypt draws many refugees because of its resettlement programs with the West; Cairo has one of the largest urban refugee populations in the world. Many East African migrants are interned or live in temporary encampments along the Egypt-Israel border, and some have been shot and killed by Egyptian border guards.
Age structure: This entry provides the distribution of the population according to age. Information is included by sex and age group as follows: 0-14 years (children), 15-24 years (early working age), 25-54 years (prime working age), 55-64 years (mature working age), 65 years and over (elderly). The age structure of a population affects a nation's key socioeconomic issues. Countries with young populations (high percentage under age 15) need to invest more in schools, while countries with older population . . . more Age structure field listing
0-14 years: 33.62% (male 18,112,550/female 16,889,155)
15-24 years: 18.01% (male 9,684,437/female 9,071,163)
25-54 years: 37.85% (male 20,032,310/female 19,376,847)
55-64 years: 6.08% (male 3,160,438/female 3,172,544)
65 years and over: 4.44% (male 2,213,539/female 2,411,457) (2020 est.)
population pyramid: population pyramid
Dependency ratios: Dependency ratios are a measure of the age structure of a population. They relate the number of individuals that are likely to be economically "dependent" on the support of others. Dependency ratios contrast the ratio of youths (ages 0-14) and the elderly (ages 65+) to the number of those in the working-age group (ages 15-64). Changes in the dependency ratio provide an indication of potential social support requirements resulting from changes in population age structures. As fertility leve . . . more Dependency ratios field listing
total dependency ratio: 64.6
youth dependency ratio: 55.8
elderly dependency ratio: 8.8
potential support ratio: 11.4 (2020 est.)
Median age: This entry is the age that divides a population into two numerically equal groups; that is, half the people are younger than this age and half are older. It is a single index that summarizes the age distribution of a population. Currently, the median age ranges from a low of about 15 in Niger and Uganda to 40 or more in several European countries and Japan. See the entry for "Age structure" for the importance of a young versus an older age structure and, by implication, a low versus a high . . . more Median age field listing
total: 24.1 years
male: 23.8 years
female: 24.5 years (2020 est.)
country comparison to the world: 166
Population growth rate: The average annual percent change in the population, resulting from a surplus (or deficit) of births over deaths and the balance of migrants entering and leaving a country. The rate may be positive or negative. The growth rate is a factor in determining how great a burden would be imposed on a country by the changing needs of its people for infrastructure (e.g., schools, hospitals, housing, roads), resources (e.g., food, water, electricity), and jobs. Rapid population growth can be seen as . . . more Population growth rate field listing
2.28% (2020 est.)
country comparison to the world: 31
Birth rate: This entry gives the average annual number of births during a year per 1,000 persons in the population at midyear; also known as crude birth rate. The birth rate is usually the dominant factor in determining the rate of population growth. It depends on both the level of fertility and the age structure of the population. Birth rate field listing
27.2 births/1,000 population (2020 est.)
country comparison to the world: 42
Death rate: This entry gives the average annual number of deaths during a year per 1,000 population at midyear; also known as crude death rate. The death rate, while only a rough indicator of the mortality situation in a country, accurately indicates the current mortality impact on population growth. This indicator is significantly affected by age distribution, and most countries will eventually show a rise in the overall death rate, in spite of continued decline in mortality at all ages, as declining . . . more Death rate field listing
4.4 deaths/1,000 population (2020 est.)
country comparison to the world: 209
Net migration rate: This entry includes the figure for the difference between the number of persons entering and leaving a country during the year per 1,000 persons (based on midyear population). An excess of persons entering the country is referred to as net immigration (e.g., 3.56 migrants/1,000 population); an excess of persons leaving the country as net emigration (e.g., -9.26 migrants/1,000 population). The net migration rate indicates the contribution of migration to the overall level of population chan . . . more Net migration rate field listing
-0.3 migrant(s)/1,000 population (2020 est.)
country comparison to the world: 117
Population distribution: This entry provides a summary description of the population dispersion within a country. While it may suggest population density, it does not provide density figures. Population distribution field listing
approximately 95% of the population lives within 20 km of the Nile River and its delta; vast areas of the country remain sparsely populated or uninhabited
Urbanization: This entry provides two measures of the degree of urbanization of a population. The first, urban population, describes the percentage of the total population living in urban areas, as defined by the country. The second, rate of urbanization, describes the projected average rate of change of the size of the urban population over the given period of time. It is possible for a country with a 100% urban population to still display a change in the rate of urbanization (up or down). For example . . . more Urbanization field listing
urban population: 42.8% of total population (2020)
rate of urbanization: 1.86% annual rate of change (2015-20 est.)
Major urban areas - population: This entry provides the population of the capital and up to six major cities defined as urban agglomerations with populations of at least 750,000 people. An urban agglomeration is defined as comprising the city or town proper and also the suburban fringe or thickly settled territory lying outside of, but adjacent to, the boundaries of the city. For smaller countries, lacking urban centers of 750,000 or more, only the population of the capital is presented. Major urban areas - population field listing
20.901 million CAIRO (capital), 5.281 million Alexandria (2020)
Sex ratio: This entry includes the number of males for each female in five age groups - at birth, under 15 years, 15-64 years, 65 years and over, and for the total population. Sex ratio at birth has recently emerged as an indicator of certain kinds of sex discrimination in some countries. For instance, high sex ratios at birth in some Asian countries are now attributed to sex-selective abortion and infanticide due to a strong preference for sons. This will affect future marriage patterns and fertilit . . . more Sex ratio field listing
at birth: 1.06 male(s)/female
0-14 years: 1.07 male(s)/female
15-24 years: 1.07 male(s)/female
25-54 years: 1.03 male(s)/female
55-64 years: 1 male(s)/female
65 years and over: 0.92 male(s)/female
total population: 1.05 male(s)/female (2020 est.)
Mother's mean age at first birth: This entry provides the mean (average) age of mothers at the birth of their first child. It is a useful indicator for gauging the success of family planning programs aiming to reduce maternal mortality, increase contraceptive use – particularly among married and unmarried adolescents – delay age at first marriage, and improve the health of newborns. Mother's mean age at first birth field listing
22.7 years (2014 est.)
note: median age at first birth among women 25-29
Maternal mortality rate: The maternal mortality rate (MMR) is the annual number of female deaths per 100,000 live births from any cause related to or aggravated by pregnancy or its management (excluding accidental or incidental causes). The MMR includes deaths during pregnancy, childbirth, or within 42 days of termination of pregnancy, irrespective of the duration and site of the pregnancy, for a specified year. Maternal mortality rate field listing
37 deaths/100,000 live births (2017 est.)
country comparison to the world: 102
Infant mortality rate: This entry gives the number of deaths of infants under one year old in a given year per 1,000 live births in the same year. This rate is often used as an indicator of the level of health in a country. Infant mortality rate field listing
total: 17.1 deaths/1,000 live births
male: 18.2 deaths/1,000 live births
female: 15.8 deaths/1,000 live births (2020 est.)
country comparison to the world: 87
Life expectancy at birth: This entry contains the average number of years to be lived by a group of people born in the same year, if mortality at each age remains constant in the future. Life expectancy at birth is also a measure of overall quality of life in a country and summarizes the mortality at all ages. It can also be thought of as indicating the potential return on investment in human capital and is necessary for the calculation of various actuarial measures. Life expectancy at birth field listing
total population: 73.7 years
male: 72.3 years
female: 75.3 years (2020 est.)
country comparison to the world: 140
Total fertility rate: This entry gives a figure for the average number of children that would be born per woman if all women lived to the end of their childbearing years and bore children according to a given fertility rate at each age. The total fertility rate (TFR) is a more direct measure of the level of fertility than the crude birth rate, since it refers to births per woman. This indicator shows the potential for population change in the country. A rate of two children per woman is considered the replaceme . . . more Total fertility rate field listing
3.29 children born/woman (2020 est.)
country comparison to the world: 45
Contraceptive prevalence rate: This field gives the percent of women of reproductive age (15-49) who are married or in union and are using, or whose sexual partner is using, a method of contraception according to the date of the most recent available data. The contraceptive prevalence rate is an indicator of health services, development, and women’s empowerment. It is also useful in understanding, past, present, and future fertility trends, especially in developing countries. Contraceptive prevalence rate field listing
58.5% (2014)
Drinking water source: This entry provides information about access to improved or unimproved drinking water sources available to segments of the population of a country. Improved drinking water - use of any of the following sources: piped water into dwelling, yard, or plot; public tap or standpipe; tubewell or borehole; protected dug well; protected spring; or rainwater collection. Unimproved drinking water - use of any of the following sources: unprotected dug well; unprotected spring; cart with small tank or . . . more Drinking water source field listing
improved: urban: 100% of population
rural: 99% of population
total: 99.4% of population
unimproved: urban: 0% of population
rural: 1% of population
total: 0.6% of population (2015 est.)
Current Health Expenditure: Current Health Expenditure (CHE) describes the share of spending on health in each country relative to the size of its economy. It includes expenditures corresponding to the final consumption of health care goods and services and excludes investment, exports, and intermediate consumption. CHE shows the importance of the health sector in the economy and indicates the priority given to health in monetary terms. Note: Current Health Expenditure replaces the former Health Expenditures field . . . more Current Health Expenditure field listing
4.6% (2016)
Physicians density: This entry gives the number of medical doctors (physicians), including generalist and specialist medical practitioners, per 1,000 of the population. Medical doctors are defined as doctors that study, diagnose, treat, and prevent illness, disease, injury, and other physical and mental impairments in humans through the application of modern medicine. They also plan, supervise, and evaluate care and treatment plans by other health care providers. The World Health Organization estimates that f . . . more Physicians density field listing
0.79 physicians/1,000 population (2017)
Hospital bed density: This entry provides the number of hospital beds per 1,000 people; it serves as a general measure of inpatient service availability. Hospital beds include inpatient beds available in public, private, general, and specialized hospitals and rehabilitation centers. In most cases, beds for both acute and chronic care are included. Because the level of inpatient services required for individual countries depends on several factors - such as demographic issues and the burden of disease - there is . . . more Hospital bed density field listing
1.6 beds/1,000 population (2014)
Sanitation facility access: This entry provides information about access to improved or unimproved sanitation facilities available to segments of the population of a country. Improved sanitation - use of any of the following facilities: flush or pour-flush to a piped sewer system, septic tank or pit latrine; ventilated improved pit (VIP) latrine; pit latrine with slab; or a composting toilet. Unimproved sanitation - use of any of the following facilities: flush or pour-flush not piped to a sewer system, septic tank . . . more Sanitation facility access field listing
improved: urban: 96.8% of population (2015 est.)
rural: 93.1% of population (2015 est.)
total: 94.7% of population (2015 est.)
unimproved: urban: 3.2% of population (2015 est.)
rural: 6.9% of population (2015 est.)
total: 5.3% of population (2015 est.)
HIV/AIDS - adult prevalence rate: This entry gives an estimate of the percentage of adults (aged 15-49) living with HIV/AIDS. The adult prevalence rate is calculated by dividing the estimated number of adults living with HIV/AIDS at yearend by the total adult population at yearend. HIV/AIDS - adult prevalence rate field listing
<.1% (2018 est.)
HIV/AIDS - people living with HIV/AIDS: This entry gives an estimate of all people (adults and children) alive at yearend with HIV infection, whether or not they have developed symptoms of AIDS. HIV/AIDS - people living with HIV/AIDS field listing
22,000 (2018 est.)
country comparison to the world: 83
HIV/AIDS - deaths: This entry gives an estimate of the number of adults and children who died of AIDS during a given calendar year. HIV/AIDS - deaths field listing
<500 (2018 est.)
Major infectious diseases: This entry lists major infectious diseases likely to be encountered in countries where the risk of such diseases is assessed to be very high as compared to the United States. These infectious diseases represent risks to US government personnel traveling to the specified country for a period of less than three years. The degree of risk is assessed by considering the foreign nature of these infectious diseases, their severity, and the probability of being affected by the diseases present. Th . . . more Major infectious diseases field listing
degree of risk: intermediate (2020)
food or waterborne diseases: bacterial diarrhea, hepatitis A, and typhoid fever
water contact diseases: schistosomiasis
Obesity - adult prevalence rate: This entry gives the percent of a country's population considered to be obese. Obesity is defined as an adult having a Body Mass Index (BMI) greater to or equal to 30.0. BMI is calculated by taking a person's weight in kg and dividing it by the person's squared height in meters. Obesity - adult prevalence rate field listing
32% (2016)
country comparison to the world: 18
Children under the age of 5 years underweight: This entry gives the percent of children under five considered to be underweight. Underweight means weight-for-age is approximately 2 kg below for standard at age one, 3 kg below standard for ages two and three, and 4 kg below standard for ages four and five. This statistic is an indicator of the nutritional status of a community. Children who suffer from growth retardation as a result of poor diets and/or recurrent infections tend to have a greater risk of suffering illness and death. Children under the age of 5 years underweight field listing
7% (2014)
country comparison to the world: 74
Education expenditures: This entry provides the public expenditure on education as a percent of GDP. Education expenditures field listing
NA
Literacy: This entry includes a definition of literacy and UNESCO's percentage estimates for populations aged 15 years and over, including total population, males, and females. There are no universal definitions and standards of literacy. Unless otherwise specified, all rates are based on the most common definition - the ability to read and write at a specified age. Detailing the standards that individual countries use to assess the ability to read and write is beyond the scope of the Factbook. Info . . . more Literacy field listing
definition: age 15 and over can read and write
total population: 71.2%
male: 76.5%
female: 65.5% (2017)
School life expectancy (primary to tertiary education): School life expectancy (SLE) is the total number of years of schooling (primary to tertiary) that a child can expect to receive, assuming that the probability of his or her being enrolled in school at any particular future age is equal to the current enrollment ratio at that age. Caution must be maintained when utilizing this indicator in international comparisons. For example, a year or grade completed in one country is not necessarily the same in terms of educational content or qualit . . . more School life expectancy (primary to tertiary education) field listing
total: 13 years
male: 13 years
female: 13 years (2016)
Unemployment, youth ages 15-24: This entry gives the percent of the total labor force ages 15-24 unemployed during a specified year. Unemployment, youth ages 15-24 field listing
total: 29.6%
male: 25.7%
female: 38.3% (2017 est.)
country comparison to the world: 32
Government :: Egypt
Country name: This entry includes all forms of the country's name approved by the US Board on Geographic Names (Italy is used as an example): conventional long form (Italian Republic), conventional short form (Italy), local long form (Repubblica Italiana), local short form (Italia), former (Kingdom of Italy), as well as the abbreviation. Also see the Terminology note. Country name field listing
conventional long form: Arab Republic of Egypt
conventional short form: Egypt
local long form: Jumhuriyat Misr al-Arabiyah
local short form: Misr
former: United Arab Republic (with Syria)
etymology: the English name "Egypt" derives from the ancient Greek name for the country "Aigyptos"; the Arabic name "Misr" can be traced to the ancient Akkadian "misru" meaning border or frontier
Government type: This entry gives the basic form of government. Definitions of the major governmental terms are as follows. (Note that for some countries more than one definition applies.): Absolute monarchy - a form of government where the monarch rules unhindered, i.e., without any laws, constitution, or legally organized opposition. Anarchy - a condition of lawlessness or political disorder brought about by the absence of governmental authority. Authoritarian - a form of government in whic . . . more Government type field listing
presidential republic
Capital: This entry gives the name of the seat of government, its geographic coordinates, the time difference relative to Coordinated Universal Time (UTC) and the time observed in Washington, DC, and, if applicable, information on daylight saving time (DST). Where appropriate, a special note has been added to highlight those countries that have multiple time zones. Capital field listing
name: Cairo
geographic coordinates: 30 03 N, 31 15 E
time difference: UTC+2 (7 hours ahead of Washington, DC, during Standard Time)
etymology: from the Arabic "al-Qahira," meaning "the victorious"
Administrative divisions: This entry generally gives the numbers, designatory terms, and first-order administrative divisions as approved by the US Board on Geographic Names (BGN). Changes that have been reported but not yet acted on by the BGN are noted. Geographic names conform to spellings approved by the BGN with the exception of the omission of diacritical marks and special characters. Administrative divisions field listing
27 governorates (muhafazat, singular - muhafazat); Ad Daqahliyah, Al Bahr al Ahmar (Red Sea), Al Buhayrah, Al Fayyum, Al Gharbiyah, Al Iskandariyah (Alexandria), Al Isma'iliyah (Ismailia), Al Jizah (Giza), Al Minufiyah, Al Minya, Al Qahirah (Cairo), Al Qalyubiyah, Al Uqsur (Luxor), Al Wadi al Jadid (New Valley), As Suways (Suez), Ash Sharqiyah, Aswan, Asyut, Bani Suwayf, Bur Sa'id (Port Said), Dumyat (Damietta), Janub Sina' (South Sinai), Kafr ash Shaykh, Matruh, Qina, Shamal Sina' (North Sinai), Suhaj
Independence: For most countries, this entry gives the date that sovereignty was achieved and from which nation, empire, or trusteeship. For the other countries, the date given may not represent "independence" in the strict sense, but rather some significant nationhood event such as the traditional founding date or the date of unification, federation, confederation, establishment, fundamental change in the form of government, or state succession. For a number of countries, the establishment of statehood . . . more Independence field listing
28 February 1922 (from UK protectorate status; the military-led revolution that began on 23 July 1952 led to a republic being declared on 18 June 1953 and all British troops withdrawn on 18 June 1956); note - it was ca. 3200 B.C. that the Two Lands of Upper (southern) and Lower (northern) Egypt were first united politically
National holiday: This entry gives the primary national day of celebration - usually independence day. National holiday field listing
Revolution Day, 23 July (1952)
Constitution: This entry provides information on a country’s constitution and includes two subfields. The history subfield includes the dates of previous constitutions and the main steps and dates in formulating and implementing the latest constitution. For countries with 1-3 previous constitutions, the years are listed; for those with 4-9 previous, the entry is listed as “several previous,” and for those with 10 or more, the entry is “many previous.” The amendments subfield summarizes the process of am . . . more Constitution field listing
history: several previous; latest approved by a constitutional committee in December 2013, approved by referendum held on 14-15 January 2014, ratified by interim president on 19 January 2014
amendments: proposed by the president of the republic or by one fifth of the House of Representatives members; a decision to accept the proposal requires majority vote by House members; passage of amendment requires a two-thirds majority vote by House members and passage by majority vote in a referendum; articles of reelection of the president and principles of freedom are not amendable unless the amendment "brings more guarantees;" amended 2019 (2019)
Legal system: This entry provides the description of a country's legal system. A statement on judicial review of legislative acts is also included for a number of countries. The legal systems of nearly all countries are generally modeled upon elements of five main types: civil law (including French law, the Napoleonic Code, Roman law, Roman-Dutch law, and Spanish law); common law (including United State law); customary law; mixed or pluralistic law; and religious law (including Islamic law). An addition . . . more Legal system field listing
mixed legal system based on Napoleonic civil and penal law, Islamic religious law, and vestiges of colonial-era laws; judicial review of the constitutionality of laws by the Supreme Constitutional Court
International law organization participation: This entry includes information on a country's acceptance of jurisdiction of the International Court of Justice (ICJ) and of the International Criminal Court (ICCt); 59 countries have accepted ICJ jurisdiction with reservations and 11 have accepted ICJ jurisdiction without reservations; 122 countries have accepted ICCt jurisdiction. Appendix B: International Organizations and Groups explains the differing mandates of the ICJ and ICCt. International law organization participation field listing
accepts compulsory ICJ jurisdiction with reservations; non-party state to the ICCt
Citizenship: This entry provides information related to the acquisition and exercise of citizenship; it includes four subfields: citizenship by birth describes the acquisition of citizenship based on place of birth, known as Jus soli, regardless of the citizenship of parents. citizenship by descent only describes the acquisition of citizenship based on the principle of Jus sanguinis, or by descent, where at least one parent is a citizen of the state and being born within the territorial limits of the s . . . more Citizenship field listing
citizenship by birth: no
citizenship by descent only: if the father was born in Egypt
dual citizenship recognized: only with prior permission from the government
residency requirement for naturalization: 10 years
Suffrage: This entry gives the age at enfranchisement and whether the right to vote is universal or restricted. Suffrage field listing
18 years of age; universal and compulsory
Executive branch: This entry includes five subentries: chief of state; head of government; cabinet; elections/appointments; election results. Chief of state includes the name, title, and beginning date in office of the titular leader of the country who represents the state at official and ceremonial functions but may not be involved with the day-to-day activities of the government. Head of government includes the name, title of the top executive designated to manage the executive branch of the government, a . . . more Executive branch field listing
chief of state: President Abdelfattah ELSISI (since 8 June 2014)
head of government: Prime Minister Mostafa MADBOULY (since 7 June 2018)
cabinet: Cabinet ministers nominated by the executive branch and approved by the House of Representatives
elections/appointments: president elected by absolute majority popular vote in 2 rounds if needed for a 6-year term (eligible for 3 consecutive terms); election last held on 26-28 March 2018 (next to be held in 2024); prime minister appointed by the president, approved by the House of Representatives; note - following a constitutional amendment approved by referendum in April 2019, the presidential term was extended from 4 to 6 years and eligibility extended to 3 consecutive terms
election results: Abdelfattah ELSISI reelected president in first round; percent of valid votes cast - Abdelfattah ELSISI (independent) 97.1%, Moussa Mostafa MOUSSA (El Ghad Party) 2.9%; note - more than 7% of ballots cast were deemed invalid
Legislative branch: This entry has three subfields. The description subfield provides the legislative structure (unicameral – single house; bicameral – an upper and a lower house); formal name(s); number of member seats; types of constituencies or voting districts (single seat, multi-seat, nationwide); electoral voting system(s); and member term of office. The elections subfield includes the dates of the last election and next election. The election results subfield lists percent of vote by party/coalition an . . . more Legislative branch field listing
description:
unicameral House of Representatives (Majlis Al-Nowaab) (596 seats; 448 members directly elected by individual candidacy system, 120 members - with quotas for women, youth, Christians and workers - elected in party-list constituencies by simple majority popular vote, and 28 members appointed by the president; members serve 5-year terms; note - inaugural session held on 10 January 2016
note: a referendum held in April 2019, approved a constitutional amendment - effective following the 2020 election - to restore the upper chamber of the legislative body, designated the Senate, with 180 seats - 60 members to be appointed by the president and 120 members to be directly elected; the amendment also calls for the reduction of the existing People's Assembly from 596 to 450 seats
elections: multi-phase election completed on 16 December 2015 (next to be held in 2020)
election results: percent of vote by party - NA; seats by party -- Free Egyptians Party 65, Future of the Nation 53, New Wafd Party 36, Homeland's Protector Party 18, Republican People's Party 13, Congress Party 12, Al-Nour Party 11, Conservative Party 6, Democratic Peace Party 5, Egyptian National Movement 4, Egyptian Social Democratic Party 4, Modern Egypt Party 4, Freedom Party 3, My Homeland Egypt Party 3, Reform and Development Party 3, National Progressive Unionist Party 2, Arab Democratic Nasserist Party 1, El Serh El Masry el Hor 1, Revolutionary Guards Party 1, independent 351; composition - men 507, women 89, percent of women 14.9%
Note: a referendum held in April 2019 approved a constitutional amendment - effective for the next election - allows the executive branch to restore the upper chamber of the legislative body with 180 seats - 60 members to be appointed by the president and 120 members to be directly elected; the amendment also calls for the reduction of the existing House of Representatives membership from 596 to 450 seats
Judicial branch: This entry includes three subfields. The highest court(s) subfield includes the name(s) of a country's highest level court(s), the number and titles of the judges, and the types of cases heard by the court, which commonly are based on civil, criminal, administrative, and constitutional law. A number of countries have separate constitutional courts. The judge selection and term of office subfield includes the organizations and associated officials responsible for nominating and appointing j . . . more Judicial branch field listing
highest courts: Supreme Constitutional Court (SCC) (consists of the court president and 10 justices); the SCC serves as the final court of arbitration on the constitutionality of laws and conflicts between lower courts regarding jurisdiction and rulings; Court of Cassation (CC) (consists of the court president and 550 judges organized in circuits with cases heard by panels of 5 judges); the CC is the highest appeals body for civil and criminal cases, also known as "ordinary justices"; Supreme Administrative Court (SAC) (consists of the court president and NA judges and organized in circuits with cases heard by panels of 5 judges); the SAC is the highest court of the State Council
judge selection and term of office: under the 2014 constitution, all judges and justices selected and appointed by the Supreme Judiciary Council and approved as a formality by the president of the Republic; judges appointed for life; under the 2019 amendments, the president has the power to appoint heads of judiciary authorities and courts, the prosecutor general, and the head of the Supreme Constitutional Court
subordinate courts: Courts of Appeal; Courts of First Instance; courts of limited jurisdiction; Family Court (established in 2004)
Political parties and leaders: This entry includes a listing of significant political parties, coalitions, and electoral lists as of each country's last legislative election, unless otherwise noted. Political parties and leaders field listing
Al-Nour [Yunis MAKHYUN]
Arab Democratic Nasserist Party [Dr. Mohamed ABDUL ELLA ]
Congress Party [Omar Al-Mokhtar SEMIDA]
Conservative Party [Akmal KOURTAM]
Democratic Peace Party [Ahmed FADALY]
Egyptian National Movement Party [Gen. Raouf EL SAYED]
Egyptian Social Democratic Party [Farid ZAHRAN]
El Ghad Party [Moussa Mostafa MOUSSA]
El Serh El Masry el Hor [Tarek Ahmed Abbas NADIM]
Freedom Party [Salah HASSABALAH]
Free Egyptians Party [Essam KHALIL]
Homeland’s Protector Party [Lt. Gen. (retired) Galal AL-HARIDI]
Modern Egypt Party [Nabil DEIBIS]
Nation's Future Party (Mostaqbal Watan) [Mohamed Ashraf RASHAD]
My Homeland Egypt Party [Gen. Seif El Islam ABDEL BARY ]
National Progressive Unionist (Tagammu) Party [Sayed Abdel AAL]
Reform and Development Party [Mohamad Anwar al-SADAT]
Republican People’s Party [Hazim AMR]
Revolutionary Guards Party [Magdy EL-SHARIF]
Wafd Party [Bahaa ABU SHOKA]
International organization participation: This entry lists in alphabetical order by abbreviation those international organizations in which the subject country is a member or participates in some other way. International organization participation field listing
ABEDA, AfDB, AFESD, AMF, AU, BSEC (observer), CAEU, CD, CICA, COMESA, D-8, EBRD, FAO, G-15, G-24, G-77, IAEA, IBRD, ICAO, ICC (national committees), ICRM, IDA, IDB, IFAD, IFC, IFRCS, IHO, ILO, IMF, IMO, IMSO, Interpol, IOC, IOM, IPU, ISO, ITSO, ITU, LAS, MIGA, MINURSO, MINUSMA, MONUSCO, NAM, OAPEC, OAS (observer), OIC, OIF, OSCE (partner), PCA, UN, UNAMID, UNCTAD, UNESCO, UNHCR, UNIDO, UNMISS, UNOCI, UNRWA, UNWTO, UPU, WCO, WFTU (NGOs), WHO, WIPO, WMO, WTO
Diplomatic representation in the US: This entry includes the chief of mission, chancery address, telephone, FAX, consulate general locations, and consulate locations. The use of the annotated title Appointed Ambassador refers to a new ambassador who has presented his/her credentials to the secretary of state but not the US president. Such ambassadors fulfill all diplomatic functions except meeting with or appearing at functions attended by the president until such time as they formally present their credentials at a White Hou . . . more Diplomatic representation in the US field listing
Ambassador Yasser REDA (since 19 September 2015)
chancery: 3521 International Court NW, Washington, DC 20008
telephone: [1] (202) 895-5400
FAX: [1] (202) 244-5131
consulate(s) general: Chicago, Houston, Los Angeles, New York
Diplomatic representation from the US: This entry includes the chief of mission, embassy address, mailing address, telephone number, FAX number, branch office locations, consulate general locations, and consulate locations. Diplomatic representation from the US field listing
chief of mission: Ambassador Jonathan R. COHEN (since 17 November 2019)
telephone: [20-2] 2797-3300
embassy: 5 Tawfik Diab St., Garden City, Cairo
mailing address: Unit 64900, Box 15, APO AE 09839-4900; 5 Tawfik Diab Street, Garden City, Cairo
FAX: [20-2] 2797-3200
Flag description: This entry provides a written flag description produced from actual flags or the best information available at the time the entry was written. The flags of independent states are used by their dependencies unless there is an officially recognized local flag. Some disputed and other areas do not have flags. Flag description field listing
three equal horizontal bands of red (top), white, and black; the national emblem (a gold Eagle of Saladin facing the hoist side with a shield superimposed on its chest above a scroll bearing the name of the country in Arabic) centered in the white band; the band colors derive from the Arab Liberation flag and represent oppression (black), overcome through bloody struggle (red), to be replaced by a bright future (white)
note: similar to the flag of Syria, which has two green stars in the white band, Iraq, which has an Arabic inscription centered in the white band, and Yemen, which has a plain white band
National symbol(s): A national symbol is a faunal, floral, or other abstract representation - or some distinctive object - that over time has come to be closely identified with a country or entity. Not all countries have national symbols; a few countries have more than one. National symbol(s) field listing
golden eagle, white lotus; national colors: red, white, black
National anthem: A generally patriotic musical composition - usually in the form of a song or hymn of praise - that evokes and eulogizes the history, traditions, or struggles of a nation or its people. National anthems can be officially recognized as a national song by a country's constitution or by an enacted law, or simply by tradition. Although most anthems contain lyrics, some do not. National anthem field listing
name: "Bilady, Bilady, Bilady" (My Homeland, My Homeland, My Homeland)
lyrics/music: Younis-al QADI/Sayed DARWISH
note: adopted 1979; the current anthem, less militaristic than the previous one, was created after the signing of the 1979 peace treaty with Israel; Sayed DARWISH, commonly considered the father of modern Egyptian music, composed the anthem
Economy :: Egypt
Economy - overview: This entry briefly describes the type of economy, including the degree of market orientation, the level of economic development, the most important natural resources, and the unique areas of specialization. It also characterizes major economic events and policy changes in the most recent 12 months and may include a statement about one or two key future macroeconomic trends. Economy - overview field listing
Occupying the northeast corner of the African continent, Egypt is bisected by the highly fertile Nile valley where most economic activity takes place. Egypt's economy was highly centralized during the rule of former President Gamal Abdel NASSER but opened up considerably under former Presidents Anwar EL-SADAT and Mohamed Hosni MUBARAK. Agriculture, hydrocarbons, manufacturing, tourism, and other service sectors drove the country’s relatively diverse economic activity.
Despite Egypt’s mixed record for attracting foreign investment over the past two decades, poor living conditions and limited job opportunities have contributed to public discontent. These socioeconomic pressures were a major factor leading to the January 2011 revolution that ousted MUBARAK. The uncertain political, security, and policy environment since 2011 has restricted economic growth and failed to alleviate persistent unemployment, especially among the young.
In late 2016, persistent dollar shortages and waning aid from its Gulf allies led Cairo to turn to the IMF for a 3-year, $12 billion loan program. To secure the deal, Cairo floated its currency, introduced new taxes, and cut energy subsidies - all of which pushed inflation above 30% for most of 2017, a high that had not been seen in a generation. Since the currency float, foreign investment in Egypt’s high interest treasury bills has risen exponentially, boosting both dollar availability and central bank reserves. Cairo will be challenged to obtain foreign and local investment in manufacturing and other sectors without a sustained effort to implement a range of business reforms.
GDP (purchasing power parity): This entry gives the gross domestic product (GDP) or value of all final goods and services produced within a nation in a given year. A nation's GDP at purchasing power parity (PPP) exchange rates is the sum value of all goods and services produced in the country valued at prices prevailing in the United States in the year noted. This is the measure most economists prefer when looking at per-capita welfare and when comparing living conditions or use of resources across countries. The measur . . . more GDP (purchasing power parity) field listing
$1.204 trillion (2017 est.)
$1.155 trillion (2016 est.)
$1.107 trillion (2015 est.)
note: data are in 2017 dollars
country comparison to the world: 21
GDP (official exchange rate): This entry gives the gross domestic product (GDP) or value of all final goods and services produced within a nation in a given year. A nation's GDP at official exchange rates (OER) is the home-currency-denominated annual GDP figure divided by the bilateral average US exchange rate with that country in that year. The measure is simple to compute and gives a precise measure of the value of output. Many economists prefer this measure when gauging the economic power an economy maintains vis- . . . more GDP (official exchange rate) field listing
$236.5 billion (2017 est.)
GDP - real growth rate: This entry gives GDP growth on an annual basis adjusted for inflation and expressed as a percent. The growth rates are year-over-year, and not compounded. GDP - real growth rate field listing
4.2% (2017 est.)
4.3% (2016 est.)
4.4% (2015 est.)
country comparison to the world: 71
GDP - per capita (PPP): This entry shows GDP on a purchasing power parity basis divided by population as of 1 July for the same year. GDP - per capita (PPP) field listing
$12,700 (2017 est.)
$12,800 (2016 est.)
$12,400 (2015 est.)
note: data are in 2017 dollars
country comparison to the world: 124
Gross national saving: Gross national saving is derived by deducting final consumption expenditure (household plus government) from Gross national disposable income, and consists of personal saving, plus business saving (the sum of the capital consumption allowance and retained business profits), plus government saving (the excess of tax revenues over expenditures), but excludes foreign saving (the excess of imports of goods and services over exports). The figures are presented as a percent of GDP. A negative . . . more Gross national saving field listing
9% of GDP (2017 est.)
9.1% of GDP (2016 est.)
10.6% of GDP (2015 est.)
country comparison to the world: 166
GDP - composition, by end use: This entry shows who does the spending in an economy: consumers, businesses, government, and foreigners. The distribution gives the percentage contribution to total GDP of household consumption, government consumption, investment in fixed capital, investment in inventories, exports of goods and services, and imports of goods and services, and will total 100 percent of GDP if the data are complete. household consumption consists of expenditures by resident households, and by nonprofit insti . . . more GDP - composition, by end use field listing
household consumption: 86.8% (2017 est.)
government consumption: 10.1% (2017 est.)
investment in fixed capital: 14.8% (2017 est.)
investment in inventories: 0.5% (2017 est.)
exports of goods and services: 16.3% (2017 est.)
imports of goods and services: -28.5% (2017 est.)
GDP - composition, by sector of origin: This entry shows where production takes place in an economy. The distribution gives the percentage contribution of agriculture, industry, and services to total GDP, and will total 100 percent of GDP if the data are complete. Agriculture includes farming, fishing, and forestry. Industry includes mining, manufacturing, energy production, and construction. Services cover government activities, communications, transportation, finance, and all other private economic activities that do not prod . . . more GDP - composition, by sector of origin field listing
agriculture: 11.7% (2017 est.)
industry: 34.3% (2017 est.)
services: 54% (2017 est.)
Agriculture - products: This entry is an ordered listing of major crops and products starting with the most important. Agriculture - products field listing
cotton, rice, corn, wheat, beans, fruits, vegetables; cattle, water buffalo, sheep, goats
Industries: This entry provides a rank ordering of industries starting with the largest by value of annual output. Industries field listing
textiles, food processing, tourism, chemicals, pharmaceuticals, hydrocarbons, construction, cement, metals, light manufactures
Industrial production growth rate: This entry gives the annual percentage increase in industrial production (includes manufacturing, mining, and construction). Industrial production growth rate field listing
3.5% (2017 est.)
country comparison to the world: 84
Labor force: This entry contains the total labor force figure. Labor force field listing
29.95 million (2017 est.)
country comparison to the world: 22
Labor force - by occupation: This entry lists the percentage distribution of the labor force by sector of occupation. Agriculture includes farming, fishing, and forestry. Industry includes mining, manufacturing, energy production, and construction. Services cover government activities, communications, transportation, finance, and all other economic activities that do not produce material goods. The distribution will total less than 100 percent if the data are incomplete and may range from 99-101 percent due to rounding. more Labor force - by occupation field listing
agriculture: 25.8%
industry: 25.1%
services: 49.1% (2015 est.)
Unemployment rate: This entry contains the percent of the labor force that is without jobs. Substantial underemployment might be noted. Unemployment rate field listing
12.2% (2017 est.)
12.7% (2016 est.)
country comparison to the world: 161
Population below poverty line: National estimates of the percentage of the population falling below the poverty line are based on surveys of sub-groups, with the results weighted by the number of people in each group. Definitions of poverty vary considerably among nations. For example, rich nations generally employ more generous standards of poverty than poor nations. Population below poverty line field listing
27.8% (2016 est.)
Household income or consumption by percentage share: Data on household income or consumption come from household surveys, the results adjusted for household size. Nations use different standards and procedures in collecting and adjusting the data. Surveys based on income will normally show a more unequal distribution than surveys based on consumption. The quality of surveys is improving with time, yet caution is still necessary in making inter-country comparisons. Household income or consumption by percentage share field listing
lowest 10%: 4%
highest 10%: 26.6% (2008)
Budget: This entry includes revenues, expenditures, and capital expenditures. These figures are calculated on an exchange rate basis, i.e., not in purchasing power parity (PPP) terms. Budget field listing
revenues: 42.32 billion (2017 est.)
expenditures: 62.61 billion (2017 est.)
Taxes and other revenues: This entry records total taxes and other revenues received by the national government during the time period indicated, expressed as a percent of GDP. Taxes include personal and corporate income taxes, value added taxes, excise taxes, and tariffs. Other revenues include social contributions - such as payments for social security and hospital insurance - grants, and net revenues from public enterprises. Normalizing the data, by dividing total revenues by GDP, enables easy comparisons acr . . . more Taxes and other revenues field listing
17.9% (of GDP) (2017 est.)
country comparison to the world: 165
Budget surplus (+) or deficit (-): This entry records the difference between national government revenues and expenditures, expressed as a percent of GDP. A positive (+) number indicates that revenues exceeded expenditures (a budget surplus), while a negative (-) number indicates the reverse (a budget deficit). Normalizing the data, by dividing the budget balance by GDP, enables easy comparisons across countries and indicates whether a national government saves or borrows money. Countries with high budget deficits (relat . . . more Budget surplus (+) or deficit (-) field listing
-8.6% (of GDP) (2017 est.)
country comparison to the world: 202
Public debt: This entry records the cumulative total of all government borrowings less repayments that are denominated in a country's home currency. Public debt should not be confused with external debt, which reflects the foreign currency liabilities of both the private and public sector and must be financed out of foreign exchange earnings. Public debt field listing
103% of GDP (2017 est.)
96.8% of GDP (2016 est.)
note: data cover central government debt and include debt instruments issued (or owned) by government entities other than the treasury; the data include treasury debt held by foreign entities; the data include debt issued by subnational entities, as well as intragovernmental debt; intragovernmental debt consists of treasury borrowings from surpluses in the social funds, such as for retirement, medical care, and unemployment; debt instruments for the social funds are sold at public auctions
country comparison to the world: 14
Fiscal year: This entry identifies the beginning and ending months for a country's accounting period of 12 months, which often is the calendar year but which may begin in any month. All yearly references are for the calendar year (CY) unless indicated as a noncalendar fiscal year (FY). Fiscal year field listing
1 July - 30 June
Inflation rate (consumer prices): This entry furnishes the annual percent change in consumer prices compared with the previous year's consumer prices. Inflation rate (consumer prices) field listing
23.5% (2017 est.)
10.2% (2016 est.)
country comparison to the world: 217
Current account balance: This entry records a country's net trade in goods and services, plus net earnings from rents, interest, profits, and dividends, and net transfer payments (such as pension funds and worker remittances) to and from the rest of the world during the period specified. These figures are calculated on an exchange rate basis, i.e., not in purchasing power parity (PPP) terms. Current account balance field listing
-$14.92 billion (2017 est.)
-$19.83 billion (2016 est.)
country comparison to the world: 196
Exports: This entry provides the total US dollar amount of merchandise exports on an f.o.b. (free on board) basis. These figures are calculated on an exchange rate basis, i.e., not in purchasing power parity (PPP) terms. Exports field listing
$23.3 billion (2017 est.)
$20.02 billion (2016 est.)
country comparison to the world: 67
Exports - partners: This entry provides a rank ordering of trading partners starting with the most important; it sometimes includes the percent of total dollar value. Exports - partners field listing
UAE 10.9%, Italy 10%, US 7.4%, UK 5.7%, Turkey 4.4%, Germany 4.3%, India 4.3% (2017)
Exports - commodities: This entry provides a listing of the highest-valued exported products; it sometimes includes the percent of total dollar value. Exports - commodities field listing
crude oil and petroleum products, fruits and vegetables, cotton, textiles, metal products, chemicals, processed food
Imports: This entry provides the total US dollar amount of merchandise imports on a c.i.f. (cost, insurance, and freight) or f.o.b. (free on board) basis. These figures are calculated on an exchange rate basis, i.e., not in purchasing power parity (PPP) terms. Imports field listing
$59.78 billion (2017 est.)
$57.84 billion (2016 est.)
country comparison to the world: 50
Imports - commodities: This entry provides a listing of the highest-valued imported products; it sometimes includes the percent of total dollar value. Imports - commodities field listing
machinery and equipment, foodstuffs, chemicals, wood products, fuels
Imports - partners: This entry provides a rank ordering of trading partners starting with the most important; it sometimes includes the percent of total dollar value. Imports - partners field listing
China 7.9%, UAE 5.2%, Germany 4.8%, Saudi Arabia 4.6%, US 4.4%, Russia 4.3% (2017)
Reserves of foreign exchange and gold: This entry gives the dollar value for the stock of all financial assets that are available to the central monetary authority for use in meeting a country's balance of payments needs as of the end-date of the period specified. This category includes not only foreign currency and gold, but also a country's holdings of Special Drawing Rights in the International Monetary Fund, and its reserve position in the Fund. Reserves of foreign exchange and gold field listing
$35.89 billion (31 December 2017 est.)
$23.2 billion (31 December 2016 est.)
country comparison to the world: 47
Debt - external: This entry gives the total public and private debt owed to nonresidents repayable in internationally accepted currencies, goods, or services. These figures are calculated on an exchange rate basis, i.e., not in purchasing power parity (PPP) terms. Debt - external field listing
$77.47 billion (31 December 2017 est.)
$62.38 billion (31 December 2016 est.)
country comparison to the world: 56
Exchange rates: This entry provides the average annual price of a country's monetary unit for the time period specified, expressed in units of local currency per US dollar, as determined by international market forces or by official fiat. The International Organization for Standardization (ISO) 4217 alphabetic currency code for the national medium of exchange is presented in parenthesis. Closing daily exchange rates are not presented in The World Factbook, but are used to convert stock values - e.g., the . . . more Exchange rates field listing
Egyptian pounds (EGP) per US dollar -
18.05 (2017 est.)
8.8 (2016 est.)
10.07 (2015 est.)
7.7133 (2014 est.)
7.08 (2013 est.)
Energy :: Egypt
Electricity access: This entry provides information on access to electricity. Electrification data – collected from industry reports, national surveys, and international sources – consists of four subfields. Population without electricity provides an estimate of the number of citizens that do not have access to electricity. Electrification – total population is the percent of a country’s total population with access to electricity, electrification – urban areas is the percent of a country’s urban population w . . . more Electricity access field listing
electrification - total population: 100% (2016)
Electricity - production: This entry is the annual electricity generated expressed in kilowatt-hours. The discrepancy between the amount of electricity generated and/or imported and the amount consumed and/or exported is accounted for as loss in transmission and distribution. Electricity - production field listing
183.5 billion kWh (2016 est.)
country comparison to the world: 22
Electricity - consumption: This entry consists of total electricity generated annually plus imports and minus exports, expressed in kilowatt-hours. The discrepancy between the amount of electricity generated and/or imported and the amount consumed and/or exported is accounted for as loss in transmission and distribution. Electricity - consumption field listing
159.7 billion kWh (2016 est.)
country comparison to the world: 23
Electricity - exports: This entry is the total exported electricity in kilowatt-hours. Electricity - exports field listing
1.158 billion kWh (2015 est.)
country comparison to the world: 57
Electricity - imports: This entry is the total imported electricity in kilowatt-hours. Electricity - imports field listing
54 million kWh (2016 est.)
country comparison to the world: 106
Electricity - installed generating capacity: This entry is the total capacity of currently installed generators, expressed in kilowatts (kW), to produce electricity. A 10-kilowatt (kW) generator will produce 10 kilowatt hours (kWh) of electricity, if it runs continuously for one hour. Electricity - installed generating capacity field listing
45.12 million kW (2016 est.)
country comparison to the world: 23
Electricity - from fossil fuels: This entry measures the capacity of plants that generate electricity by burning fossil fuels (such as coal, petroleum products, and natural gas), expressed as a share of the country's total generating capacity. Electricity - from fossil fuels field listing
91% of total installed capacity (2016 est.)
country comparison to the world: 54
Electricity - from nuclear fuels: This entry measures the capacity of plants that generate electricity through radioactive decay of nuclear fuel, expressed as a share of the country's total generating capacity. Electricity - from nuclear fuels field listing
0% of total installed capacity (2017 est.)
country comparison to the world: 82
Electricity - from hydroelectric plants: This entry measures the capacity of plants that generate electricity by water-driven turbines, expressed as a share of the country's total generating capacity. Electricity - from hydroelectric plants field listing
6% of total installed capacity (2017 est.)
country comparison to the world: 129
Electricity - from other renewable sources: This entry measures the capacity of plants that generate electricity by using renewable energy sources other than hydroelectric (including, for example, wind, waves, solar, and geothermal), expressed as a share of the country's total generating capacity. Electricity - from other renewable sources field listing
2% of total installed capacity (2017 est.)
country comparison to the world: 139
Crude oil - production: This entry is the total amount of crude oil produced, in barrels per day (bbl/day). Crude oil - production field listing
639,000 bbl/day (2018 est.)
country comparison to the world: 27
Crude oil - exports: This entry is the total amount of crude oil exported, in barrels per day (bbl/day). Crude oil - exports field listing
246,500 bbl/day (2017 est.)
country comparison to the world: 29
Crude oil - imports: This entry is the total amount of crude oil imported, in barrels per day (bbl/day). Crude oil - imports field listing
64,760 bbl/day (2015 est.)
country comparison to the world: 51
Crude oil - proved reserves: This entry is the stock of proved reserves of crude oil, in barrels (bbl). Proved reserves are those quantities of petroleum which, by analysis of geological and engineering data, can be estimated with a high degree of confidence to be commercially recoverable from a given date forward, from known reservoirs and under current economic conditions. Crude oil - proved reserves field listing
4.4 billion bbl (1 January 2018 est.)
country comparison to the world: 24
Refined petroleum products - production: This entry is the country's total output of refined petroleum products, in barrels per day (bbl/day). The discrepancy between the amount of refined petroleum products produced and/or imported and the amount consumed and/or exported is due to the omission of stock changes, refinery gains, and other complicating factors. Refined petroleum products - production field listing
547,500 bbl/day (2015 est.)
country comparison to the world: 31
Refined petroleum products - consumption: This entry is the country's total consumption of refined petroleum products, in barrels per day (bbl/day). The discrepancy between the amount of refined petroleum products produced and/or imported and the amount consumed and/or exported is due to the omission of stock changes, refinery gains, and other complicating factors. Refined petroleum products - consumption field listing
878,000 bbl/day (2016 est.)
country comparison to the world: 25
Refined petroleum products - exports: This entry is the country's total exports of refined petroleum products, in barrels per day (bbl/day). Refined petroleum products - exports field listing
47,360 bbl/day (2015 est.)
country comparison to the world: 56
Refined petroleum products - imports: This entry is the country's total imports of refined petroleum products, in barrels per day (bbl/day). Refined petroleum products - imports field listing
280,200 bbl/day (2015 est.)
country comparison to the world: 26
Natural gas - production: This entry is the total natural gas produced in cubic meters (cu m). The discrepancy between the amount of natural gas produced and/or imported and the amount consumed and/or exported is due to the omission of stock changes and other complicating factors. Natural gas - production field listing
50.86 billion cu m (2017 est.)
country comparison to the world: 16
Natural gas - consumption: This entry is the total natural gas consumed in cubic meters (cu m). The discrepancy between the amount of natural gas produced and/or imported and the amount consumed and/or exported is due to the omission of stock changes and other complicating factors. Natural gas - consumption field listing
57.71 billion cu m (2017 est.)
country comparison to the world: 13
Natural gas - exports: This entry is the total natural gas exported in cubic meters (cu m). Natural gas - exports field listing
212.4 million cu m (2017 est.)
country comparison to the world: 45
Natural gas - imports: This entry is the total natural gas imported in cubic meters (cu m). Natural gas - imports field listing
7.079 billion cu m (2017 est.)
country comparison to the world: 29
Natural gas - proved reserves: This entry is the stock of proved reserves of natural gas in cubic meters (cu m). Proved reserves are those quantities of natural gas, which, by analysis of geological and engineering data, can be estimated with a high degree of confidence to be commercially recoverable from a given date forward, from known reservoirs and under current economic conditions. Natural gas - proved reserves field listing
2.186 trillion cu m (1 January 2018 est.)
country comparison to the world: 15
Carbon dioxide emissions from consumption of energy: This entry is the total amount of carbon dioxide, measured in metric tons, released by burning fossil fuels in the process of producing and consuming energy. Carbon dioxide emissions from consumption of energy field listing
232.7 million Mt (2017 est.)
country comparison to the world: 30
Communications :: Egypt
Telephones - fixed lines: This entry gives the total number of fixed telephone lines in use, as well as the number of subscriptions per 100 inhabitants. Telephones - fixed lines field listing
total subscriptions: 7,865,286
subscriptions per 100 inhabitants: 8 (2018 est.)
country comparison to the world: 21
Telephones - mobile cellular: This entry gives the total number of mobile cellular telephone subscribers, as well as the number of subscriptions per 100 inhabitants. Note that because of the ubiquity of mobile phone use in developed countries, the number of subscriptions per 100 inhabitants can exceed 100. Telephones - mobile cellular field listing
total subscriptions: 93,784,497
subscriptions per 100 inhabitants: 94 (2018 est.)
country comparison to the world: 16
Telecommunication systems: This entry includes a brief general assessment of the telecommunications system with details on the domestic and international components. The following terms and abbreviations are used throughout the entry: Arabsat - Arab Satellite Communications Organization (Riyadh, Saudi Arabia). Autodin - Automatic Digital Network (US Department of Defense). CB - citizen's band mobile radio communications. Cellular telephone system - the telephones in this system are radio transceivers, with each inst . . . more Telecommunication systems field listing
general assessment: one of the largest fixed-line systems in Africa and the Arab region; has one of the largest mobile telecom markets in North Africa; penetration rate of about 94%; launch of LTE in late 2017 which greatly helped the capabilities of mobile broadband services, expands LTE infrastructure and begins to develop 5G network; govt recent efforts to fund next generation networks, develop technology parks and extend broadband availability (2020)
domestic: fixed-line 8 per 100, mobile-cellular 94 per 100 (2018)
international: country code - 20; landing points for Aletar, Africa-1, FEA, Hawk, IMEWE, and the SEA-ME-WE-3 & 4 submarine cable networks linking to Asia, Africa, the Middle East, and Australia ; satellite earth stations - 4 (2 Intelsat - Atlantic Ocean and Indian Ocean, 1 Arabsat, and 1 Inmarsat); tropospheric scatter to Sudan; microwave radio relay to Israel; a participant in Medarabtel (2019)
the COVID-19 outbreak is negatively impacting telecommunications production and supply chains globally; consumer spending on telecom devices and services has also slowed due to the pandemic's effect on economies worldwide; overall progress towards improvements in all facets of the telecom industry - mobile, fixed-line, broadband, submarine cable and satellite - has moderated
Broadcast media: This entry provides information on the approximate number of public and private TV and radio stations in a country, as well as basic information on the availability of satellite and cable TV services. Broadcast media field listing
mix of state-run and private broadcast media; state-run TV operates 2 national and 6 regional terrestrial networks, as well as a few satellite channels; dozens of private satellite channels and a large number of Arabic satellite channels are available for free; some limited satellite services are also available via subscription; state-run radio operates about 30 stations belonging to 8 networks; privately-owned radio includes 8 major stations, 4 of which belong to 1 network (2019)
Internet country code: This entry includes the two-letter codes maintained by the International Organization for Standardization (ISO) in the ISO 3166 Alpha-2 list and used by the Internet Assigned Numbers Authority (IANA) to establish country-coded top-level domains (ccTLDs). Internet country code field listing
.eg
Internet users: This entry gives the total number of individuals within a country who can access the Internet at home, via any device type (computer or mobile) and connection. The percent of population with Internet access (i.e., the penetration rate) helps gauge how widespread Internet use is within a country. Statistics vary from country to country and may include users who access the Internet at least several times a week to those who access it only once within a period of several months. Internet users field listing
total: 39,097,468
percent of population: 41.3% (2016 est.)
country comparison to the world: 19
Broadband - fixed subscriptions: This entry gives the total number of fixed-broadband subscriptions, as well as the number of subscriptions per 100 inhabitants. Fixed broadband is a physical wired connection to the Internet (e.g., coaxial cable, optical fiber) at speeds equal to or greater than 256 kilobits/second (256 kbit/s). Broadband - fixed subscriptions field listing
total: 6,579,762
subscriptions per 100 inhabitants: 7 (2018 est.)
country comparison to the world: 26
Communications - note: This entry includes miscellaneous communications information of significance not included elsewhere. Communications - note field listing
one of the largest and most famous libraries in the ancient world was the Great Library of Alexandria in Egypt (founded about 295 B.C., it may have survived in some form into the 5th century A.D.); seeking to resurrect the great center of learning and communication, the Egyptian Government in 2002 inaugurated the Bibliotheca Alexandrina, an Egyptian National Library on the site of the original Great Library, which commemorates the original archive and also serves as a center of cultural and scientific excellence
Military and Security :: Egypt
Military expenditures: This entry gives spending on defense programs for the most recent year available as a percent of gross domestic product (GDP); the GDP is calculated on an exchange rate basis, i.e., not in terms of purchasing power parity (PPP). For countries with no military forces, this figure can include expenditures on public security and police. Military expenditures field listing
1.2% of GDP (2019)
1.2% of GDP (2018)
1.4% of GDP (2017)
1.7% of GDP (2016)
1.7% of GDP (2015)
country comparison to the world: 103
Military and security forces: This entry lists the military and security forces subordinate to defense ministries or the equivalent (typically ground, naval, air, and marine forces), as well as those belonging to interior ministries or the equivalent (typically gendarmeries, border/coast guards, paramilitary police, and other internal security forces). Military and security forces field listing
Egyptian Armed Forces (EAF): Army (includes surface-to-surface missile forces, special forces, Republican Guard), Navy (includes coastal defense, Coast Guard), Air Force, Air Defense Command; Ministry of Interior: Central Security Forces, National Police (2019)
note: some tribal militias in the Sinai Peninsula cooperate with the Egyptian military against insurgent/terrorist groups such as the Islamic State
Military service age and obligation: This entry gives the required ages for voluntary or conscript military service and the length of service obligation. Military service age and obligation field listing
18-30 years of age for male conscript military service; service obligation - 18-36 months, followed by a 9-year reserve obligation; voluntary enlistment possible from age 15 (2017)
Military - note: This entry includes miscellaneous military information of significance not included elsewhere. Military - note field listing
the Multinational Force & Observers (MFO) has operated in the Sinai since 1982 as a peacekeeping and monitoring force to supervise the implementation of the security provisions of the 1979 Egyptian-Israeli Treaty of Peace; the MFO is an independent international organization, created by agreement between the Arab Republic of Egypt and the State of Israel; it is composed of 1,150 troops from 13 countries
Hide
Transportation :: Egypt
Panel - Expanded
National air transport system: This entry includes four subfields describing the air transport system of a given country in terms of both structure and performance. The first subfield, number of registered air carriers, indicates the total number of air carriers registered with the country’s national aviation authority and issued an air operator certificate as required by the Convention on International Civil Aviation. The second subfield, inventory of registered aircraft operated by air carriers, lists the total number . . . more National air transport system field listing
number of registered air carriers: 14 (2015)
inventory of registered aircraft operated by air carriers: 101 (2015)
annual passenger traffic on registered air carriers: 10,159,464 (2015)
annual freight traffic on registered air carriers: 397,531,535 mt-km (2015)
Civil aircraft registration country code prefix: This entry provides the one- or two-character alphanumeric code indicating the nationality of civil aircraft. Article 20 of the Convention on International Civil Aviation (Chicago Convention), signed in 1944, requires that all aircraft engaged in international air navigation bear appropriate nationality marks. The aircraft registration number consists of two parts: a prefix consisting of a one- or two-character alphanumeric code indicating nationality and a registration suffix of one to fi . . . more Civil aircraft registration country code prefix field listing
SU (2016)
Airports: This entry gives the total number of airports or airfields recognizable from the air. The runway(s) may be paved (concrete or asphalt surfaces) or unpaved (grass, earth, sand, or gravel surfaces) and may include closed or abandoned installations. Airports or airfields that are no longer recognizable (overgrown, no facilities, etc.) are not included. Note that not all airports have accommodations for refueling, maintenance, or air traffic control. Airports field listing
83 (2013)
country comparison to the world: 65
Airports - with paved runways: This entry gives the total number of airports with paved runways (concrete or asphalt surfaces) by length. For airports with more than one runway, only the longest runway is included according to the following five groups - (1) over 3,047 m (over 10,000 ft), (2) 2,438 to 3,047 m (8,000 to 10,000 ft), (3) 1,524 to 2,437 m (5,000 to 8,000 ft), (4) 914 to 1,523 m (3,000 to 5,000 ft), and (5) under 914 m (under 3,000 ft). Only airports with usable runways are included in this listing. Not all . . . more Airports - with paved runways field listing
total: 72 (2017)
over 3,047 m: 15 (2017)
2,438 to 3,047 m: 36 (2017)
1,524 to 2,437 m: 15 (2017)
under 914 m: 6 (2017)
Airports - with unpaved runways: This entry gives the total number of airports with unpaved runways (grass, dirt, sand, or gravel surfaces) by length. For airports with more than one runway, only the longest runway is included according to the following five groups - (1) over 3,047 m (over 10,000 ft), (2) 2,438 to 3,047 m (8,000 to 10,000 ft), (3) 1,524 to 2,437 m (5,000 to 8,000 ft), (4) 914 to 1,523 m (3,000 to 5,000 ft), and (5) under 914 m (under 3,000 ft). Only airports with usable runways are included in this listin . . . more Airports - with unpaved runways field listing
total: 11 (2013)
2,438 to 3,047 m: 1 (2013)
1,524 to 2,437 m: 3 (2013)
914 to 1,523 m: 4 (2013)
under 914 m: 3 (2013)
Heliports: This entry gives the total number of heliports with hard-surface runways, helipads, or landing areas that support routine sustained helicopter operations exclusively and have support facilities including one or more of the following facilities: lighting, fuel, passenger handling, or maintenance. It includes former airports used exclusively for helicopter operations but excludes heliports limited to day operations and natural clearings that could support helicopter landings and takeoffs. Heliports field listing
7 (2013)
Pipelines: This entry gives the lengths and types of pipelines for transporting products like natural gas, crude oil, or petroleum products. Pipelines field listing
486 km condensate, 74 km condensate/gas, 7986 km gas, 957 km liquid petroleum gas, 5225 km oil, 37 km oil/gas/water, 895 km refined products, 65 km water (2013)
Railways: This entry states the total route length of the railway network and of its component parts by gauge, which is the measure of the distance between the inner sides of the load-bearing rails. The four typical types of gauges are: broad, standard, narrow, and dual. Other gauges are listed under note. Some 60% of the world's railways use the standard gauge of 1.4 m (4.7 ft). Gauges vary by country and sometimes within countries. The choice of gauge during initial construction was mainly in resp . . . more Railways field listing
total: 5,085 km (2014)
standard gauge: 5,085 km 1.435-m gauge (62 km electrified) (2014)
country comparison to the world: 39
Roadways: This entry gives the total length of the road network and includes the length of the paved and unpaved portions. Roadways field listing
total: 65,050 km (2017)
paved: 48,000 km (2017)
unpaved: 17,050 km (2017)
country comparison to the world: 73
Waterways: This entry gives the total length of navigable rivers, canals, and other inland bodies of water. Waterways field listing
3,500 km (includes the Nile River, Lake Nasser, Alexandria-Cairo Waterway, and numerous smaller canals in Nile Delta; the Suez Canal (193.5 km including approaches) is navigable by oceangoing vessels drawing up to 17.68 m) (2011)
country comparison to the world: 29
Merchant marine: This entry provides the total and the number of each type of privately or publicly owned commercial ship for each country; military ships are not included; the five ships by type include: bulk carrier - for cargo such as coal, grain, cement, ores, and gravel; container ship - for loads in truck-size containers, a transportation system called containerization; general cargo - also referred to as break-bulk containers - for a wide variety of packaged merchandise, such as textiles, furniture . . . more Merchant marine field listing
total: 393
by type: bulk carrier 13, container ship 7, general cargo 28, oil tanker 36, other 309 (2019)
country comparison to the world: 45
Ports and terminals: This entry lists major ports and terminals primarily on the basis of the amount of cargo tonnage shipped through the facilities on an annual basis. In some instances, the number of containers handled or ship visits were also considered. Most ports service multiple classes of vessels including bulk carriers (dry and liquid), break bulk cargoes (goods loaded individually in bags, boxes, crates, or drums; sometimes palletized), containers, roll-on/roll-off, and passenger ships. The listing le . . . more Ports and terminals field listing
major seaport(s): Mediterranean Sea - Alexandria, Damietta, El Dekheila, Port Said
oil terminal(s): Ain Sukhna terminal, Sidi Kerir terminal
container port(s) (TEUs): Alexandria (1,613,000), Port Said (East) (2,968,308) (2017)
LNG terminal(s) (export): Damietta, Idku (Abu Qir Bay)
Gulf of Suez - Suez
Terrorism :: Egypt
Terrorist groups - home based: This entry provides information on the US State Department's designated Foreign Terrorist Organizations headquartered in a specific country, which may or may not be a group's country of origin. Details on each organization's aim(s) and area(s) of operation are provided. Terrorist groups - home based field listing
Islamic State of Iraq and ash-Sham (ISIS)-Sinai Province: aim(s): spread the ISIS caliphate by eliminating the Egyptian Government, destroying Israel, and establishing an Islamic emirate in the Sinai
area(s) of operation: operations are based out of the Sinai Peninsula, but its reach extends to Cairo, the Egyptian Nile Valley, and Gaza; operations mainly target Egyptian security forces, but also include attacks on civilians, as well as kidnappings
note: formerly known as Ansar Bayt al-Maqdis; core ISIS refers to Egypt as its Wilayat Sinai (2018)
Terrorist groups - foreign based: This entry provides information on the US State Department's designated Foreign Terrorist Organizations operating in countries other than where a particular group is headquartered. Details on each organization's aim(s) and area(s) of operation are provided. Terrorist groups - foreign based field listing
al-Qa'ida (AQ): aim(s): overthrow the Egyptian Government and, ultimately, establish a pan-Islamic caliphate under a strict Salafi Muslim interpretation of sharia
area(s) of operation: maintains a longtime operational presence and established networks (2018)
Army of Islam (AOI): aim(s): disrupt the Egyptian Government's efforts to provide security and, ultimately, establish an Islamic caliphate
area(s) of operation: operational mainly in Cairo and the Sinai Peninsula
note: associated with ISIS-Sinai Province; targets Israeli Government interests, sometimes in collaboration with the Mujahidin Shura Council in the Environs of Jerusalem (2018)
Transnational Issues :: Egypt
Disputes - international: This entry includes a wide variety of situations that range from traditional bilateral boundary disputes to unilateral claims of one sort or another. Information regarding disputes over international terrestrial and maritime boundaries has been reviewed by the US Department of State. References to other situations involving borders or frontiers may also be included, such as resource disputes, geopolitical questions, or irredentist issues; however, inclusion does not necessarily constitute . . . more Disputes - international field listing
Sudan claims but Egypt de facto administers security and economic development of Halaib region north of the 22nd parallel boundary; Egypt no longer shows its administration of the Bir Tawil trapezoid in Sudan on its maps; Gazan breaches in the security wall with Egypt in January 2008 highlight difficulties in monitoring the Sinai border; Saudi Arabia claims Egyptian-administered islands of Tiran and Sanafir
Refugees and internally displaced persons: This entry includes those persons residing in a country as refugees, internally displaced persons (IDPs), or stateless persons. Each country's refugee entry includes only countries of origin that are the source of refugee populations of 5,000 or more. The definition of a refugee according to a UN Convention is "a person who is outside his/her country of nationality or habitual residence; has a well-founded fear of persecution because of his/her race, religion, nationality, membership in a . . . more Refugees and internally displaced persons field listing
refugees (country of origin): 70,021 (West Bank and Gaza Strip) (2018); 47,763 (Sudan) (refugees and asylum seekers), 19,013 (South Sudan) (refugees and asylum seekers), 18,232 (Eritrea) (refugees and asylum seekers), 16,256 (Ethiopia) (refugees and asylum seekers), 6,903 (Somalia) (refugees and asylum seekers), 6,752 (Iraq) (refugees and asylum seekers) (2019); 129,957 (Syria) (refugees and asylum seekers) (2020)
IDPs: 97,000 (2018)
Trafficking in persons: Trafficking in persons is modern-day slavery, involving victims who are forced, defrauded, or coerced into labor or sexual exploitation. The International Labor Organization (ILO), the UN agency charged with addressing labor standards, employment, and social protection issues, estimated in 2011 that 20.9 million people worldwide were victims of forced labor, bonded labor, forced child labor, sexual servitude, and involuntary servitude. Human trafficking is a multi-dimensional threat, depri . . . more Trafficking in persons field listing
current situation: Egypt is a source, transit, and destination country for men, women, and children subjected to sex trafficking and forced labor; Egyptian children, including the large population of street children are vulnerable to forced labor in domestic service, begging and agriculture or may be victims of sex trafficking or child sex tourism, which occurs in Cairo, Alexandria, and Luxor; some Egyptian women and girls are sold into "temporary" or "summer" marriages with Gulf men, through the complicity of their parents or marriage brokers, and are exploited for prostitution or forced labor; Egyptian men are subject to forced labor in neighboring countries, while adults from South and Southeast Asia and East Africa – and increasingly Syrian refugees – are forced to work in domestic service, construction, cleaning, and begging in Egypt; women and girls, including migrants and refugees, from Asia, Sub-Saharan Africa, and the Middle East are sex trafficked in Egypt; the Egyptian military cracked down on criminal group’s smuggling, abducting, trafficking, and extorting African migrants in the Sinai Peninsula, but the practice has reemerged along Egypt’s western border with Libya
tier rating: Tier 2 Watch List – Egypt does not fully comply with the minimum standards for the elimination of trafficking; however, it is making significant efforts to do so; the government gathered data nationwide on trafficking cases to better allocate and prioritize anti-trafficking efforts, but overall it did not demonstrate increased progress; prosecutions increased in 2014, but no offenders were convicted for the second consecutive year; fewer trafficking victims were identified in 2014, which represents a significant and ongoing decrease from the previous two reporting periods; the government relied on NGOs and international organizations to identify and refer victims to protective services, and focused on Egyptian victims and refused to provide some services to foreign victims, at times including shelter (2015)
Illicit drugs: This entry gives information on the five categories of illicit drugs - narcotics, stimulants, depressants (sedatives), hallucinogens, and cannabis. These categories include many drugs legally produced and prescribed by doctors as well as those illegally produced and sold outside of medical channels. Cannabis (Cannabis sativa) is the common hemp plant, which provides hallucinogens with some sedative properties, and includes marijuana (pot, Acapulco gold, grass, reefer), tetrahydroca . . . more Illicit drugs field listing
transit point for cannabis, heroin, and opium moving to Europe, Israel, and North Africa; transit stop for Nigerian drug couriers; concern as money laundering site due to lax enforcement of financial regulations
